In SaaS, metrics aren’t just numbers on a dashboard. They tell the story of your company’s health, scalability, and valuation potential. At some point, your story must be supported by numbers and metrics. Let’s find out what metrics you need to showcase in a Series A funding round.
When I talk to scaling founders, I like to say that metrics and financial maturity serve two goals. First, the right numbers help you confidently lead your business. Second, those same numbers will be requested by potential buyers and investors during due diligence.
The right metrics show whether your revenue engine is efficient, your customers are sticking around, and your cash runway can support the next stage of growth. Without a clear metrics foundation, even strong products can struggle to raise capital or make confident operating decisions.
Let’s see what you’ll be asked for during a Series A fundraise for your SaaS or AI business.
Annual Recurring Revenue (ARR)
What: ARR is your yearly run-rate of recurring revenue. It can be built from a revenue number or a contracted number.
Why: It’s the baseline for growth and valuation. Investors, Boards, and acquirers all benchmark companies on ARR scale.
Investor View: ARR validates traction and market fit. Many investors expect $1.5 to 3M ARR as a baseline for Series A fundraise. A strong ARR demonstrates that your product and early go-to-market motion are working. Traction is the key!
Resource: How to Define ARR
MRR Schedule
What: Revenue by customer by month. Not exactly a metric but every investors wants this data.
Why: It’s the foundation for retention analysis and revenue forecasting.
Investor View: Investors look for consistent, predictable MRR growth with low volatility. They’ll slice and dice your MRR schedule to create gross revenue retention, net revenue retention, and logo retention.
Resource: Your MRR Schedule Could Cost You Millions in Valuation
Year-over-Year (YoY) Growth
What: The percentage increase in ARR or revenue over the prior year.
Why: YoY growth shows your velocity. How fast you’re scaling.
Investor View: Investors want to see rapid growth: Growth is often subjective but for early-stage SaaS, 2–3x growth will be expected for top-tier Series A raises. Growth attracts capital and will always be sexy.
Resource: Five Pillar SaaS Metrics Framework
Gross Margin
What: Total revenue less COGS (cost of goods sold) equal your gross profit and gross profit margin.
Why: Gross margin measures your revenue delivery efficiency and scalability. At t this stage your GP% profile is still forming. I measure it, but I don’t over rotate on it unless it is really poor. This may be more of a business model discussion. As you scale, how do you support your revenue?
Investor View: High gross margins (typically 70%+ in SaaS) signal a scalable software business rather than a services model. Low margins raise questions about cost structure, revenue mix or pricing flaws. Or if you really have a software business.
Resource: Your SaaS Cost of Goods Sold (COGS) Is Probably Wrong
Customer Acquisition Cost (CAC)
What: The total fully burdened sales and marketing cost to acquire one new customer.
Why: CAC reveals how much capital is needed to grow. CAC can swing wildly at this stage depending on the maturity stage of your go-to-market motion. I calculate and monitor.
Investor View: Investors scrutinize CAC for scalability. Of course, CAC is not a standalone metric. You’ll want to prove your CAC Payback Period.
Resource: How to Calculate Customer Acquisition Costs (CAC)
CAC Payback Period
What: The number of months required to pay back the upfront cost to acquire a customer. Gross-margin adjusted is the standard formula.
Why: A shorter payback means faster capital recovery and stronger cash efficiency.
Investor View: GTM requires a lot of dollars. Investors are testing the repeatability of your GTM motion. On dollar by dollar basis, you’ll scale faster with the same amount of capital as your peer when you have a shorter CAC Payback Period.
Resource: How to Calculate CAC Payback Period
Lifetime Value (LTV or CLTV)
What: The estimated gross margin-adjusted value of a customer over their lifetime. This is a point-in-time metric.
Why: The higher LTV, the more you can spend on CAC. Low LTV kills recurring revenue businesses. You go nowhere fast with LTV to CAC of less than three.
Investor View: Investors look for LTV/CAC ratios above 3x. However, this varies based on your ACV size. And new benchmarks show the rule of thumb is around 4x.
Resource: How to Calculate Customer Lifetime Value (CLTV)
Net Revenue Retention (NRR)
What: The percentage of recurring revenue retained from existing customers after accounting for expansion, contraction, and churn. A huge valuation metric.
Why: NRR > 100% means your existing base grows even without new sales.
Investor View: NRR is one of the most important investor metrics. 110–120%+ shows that your customers can scale through your product line and signal potential pricing power. 120% and above is considered top tier.
Resource: How to Calculate Net Revenue Retention
Gross Revenue Retention (GRR)
What: The percentage of recurring revenue retained from existing customers after accounting for contraction and churn.
Why: GRR shows your core customer health independent of expansion. This is the metric for the health of your recurring revenue.
Investor View: Investors don’t want to invest and then you lose all of your customers. High GRR combined with a great new customer sales motion are keys to exponential growth. Low GRR is a big handicap on your valuation and your chance to scale fast.
Resource: How to Calculate Gross Revenue Retention
Burn Multiple
What: The Burn Multiple measures how efficiently a company converts cash burn into new ARR.
Why: This metric answers a simple question: How much cash does it take to add $1 of recurring revenue? It’s a clear efficiency ratio that connects growth with capital discipline.
Investor View: Venture investors — including David Sacks of Craft Ventures — rely on Burn Multiple as the single best indicator of efficiency during growth.
Resource: David Sacks on Burn Multiple
Sales Efficiency (Magic Number / Cost of ARR)
What: Measures how effectively S&M spend converts into new ARR.
Why: It shows the ROI of your go-to-market engine. I prefer the Cost of ARR over the SaaS Magic Number.
Investor View: Investors look for Magic Number > 1.0. Cost of ARR benchmarks vary by your ACV segment.
Resource: The Cost of ARR – One of My Favorite SaaS Metrics
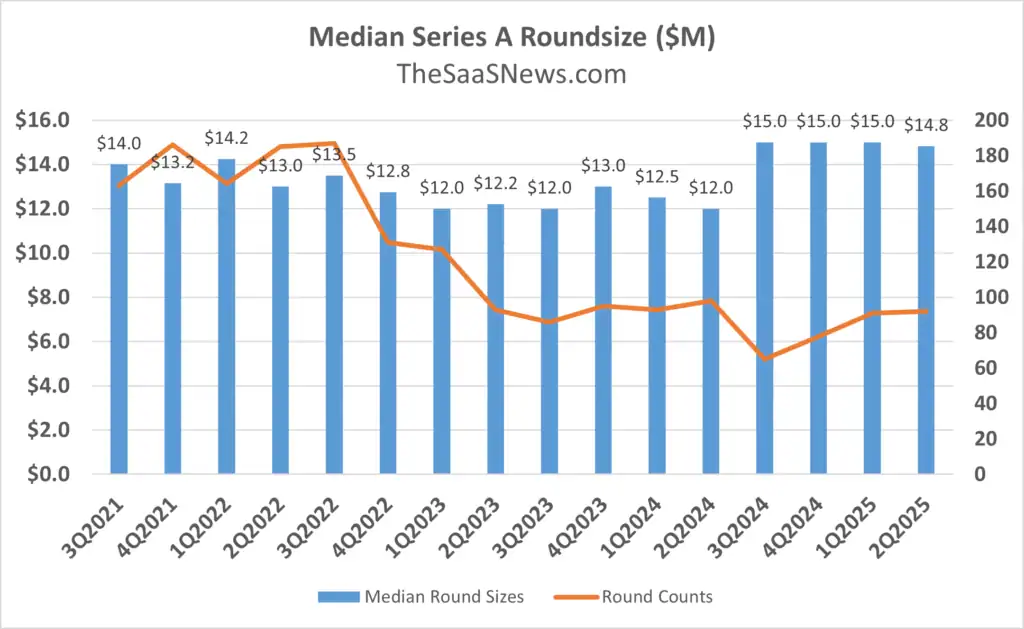
Series A Round Sizes
I have a tech news site where we covered tech fundraising events at TheSaaSNews.com.
Here are the latest Series A round sizes by quarter. You can download the full report here.
Final Takeaway: Turn Your Metrics Into Momentum
If you’re building or scaling a SaaS business, don’t treat metrics as a reporting exercise. Treat them as your competitive advantage. They back up your story in a Series A raise and future raise. Your goal is to show traction in the metrics.
Your numbers should guide every strategic decision. Founders who understand these metrics can tell a powerful story to investors, manage burn proactively, and forecast with confidence.
Start simple: get your accounting foundation right, build your MRR schedule, and begin working your way through my 5 Pillar SaaS Metrics Framework from left to right.
Investors fund clarity and discipline and founders who have a grasp of their numbers. When you can explain your growth, retention, and efficiency metrics in the same language they use, you build credibility and valuation leverage.
Want me to build your Series A metrics, contact me here.

I have worked in finance and accounting for 25+ years. I’ve been a SaaS CFO for 9+ years and began my career in the FP&A function. I hold an active Tennessee CPA license and earned my undergraduate degree from the University of Colorado at Boulder and MBA from the University of Iowa. I offer coaching, fractional CFO services, and SaaS finance courses.