
Most founders find out what their company is worth during an exit process. A letter of intent (LOI) gets sent over, and you’ll see the buyers’ valuation ranges. Some way low. Some in a reasonable range. Usually, not on the high side of expectations.
But how do you know what valuation range to expect? Valuation is a bit art and science. You can’t control the buyer’s “art” process, but you can control the science part. The hard data that drives exit discussions.
Due diligence is the worst possible time to discover weaknesses in your data foundation that drive the science. You must control the narrative.
This post is your exit readiness scoring guide. I will walk through the exact scorecard, how to calculate each input with rigor, the mistakes that inflate your score, the benchmarks to grade against, and how to turn the result into a defensible valuation range.
If you are the founder, you want your headline valuation number. Am I building value? If you are the CFO or finance lead, you want to know that your data structure, data, and metrics definitions will survive diligence. My pillars below serve both perspectives.
This is a longer post than normal, so I have some guides and calculators for download below.
What Software Public Comps Prove
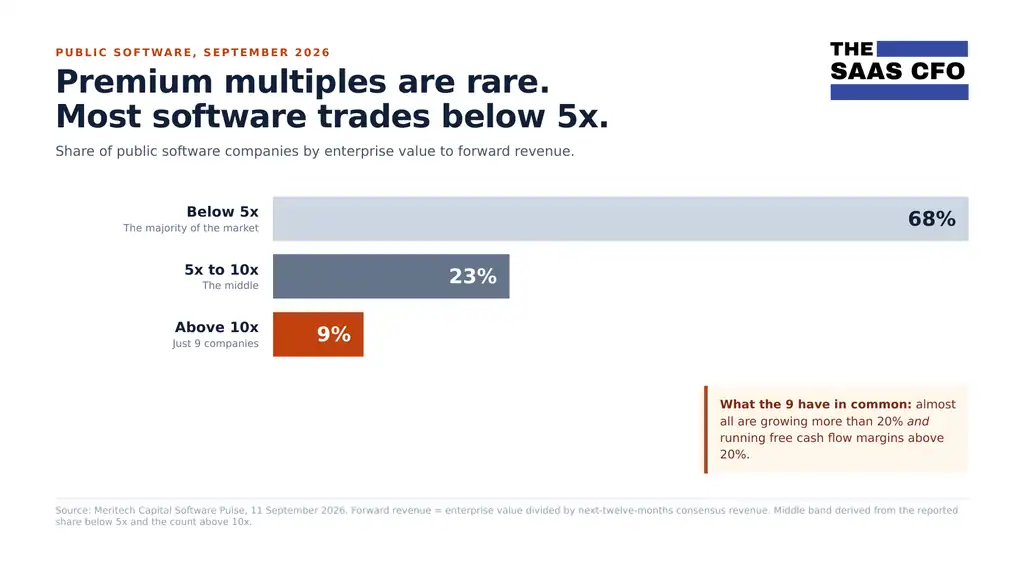
Year after year software comps prove the metrics benchmarks that receive valuation attention. Public software companies do not trade at the same multiple. As of mid-September 2026, only nine public software companies traded above 10x forward revenue, enterprise value divided by next-twelve-month revenue, while 68 percent traded below 5x.[1]
What drives this valuation gap?
The companies at the top of the market were generally doing two things at once:
- growing more than 20 percent
- and producing free-cash-flow margins above 20 percent.[1]
The takeaway is simple: a high multiple is earned by a high-quality revenue base. Growth matters, but the market wants growth that is durable and economically efficient.
Meritech reports that the relationship between growth and valuation multiple is now the strongest it has been in more than five years, with AI-related growth contributing to the rebound.[2]
Public vs. Private Company Multiples
Public company multiples are useful reference points, but they are not private company prices. Private transactions often trade at lower multiples because private businesses are smaller, less liquid, and carry more company-specific risk. Private buyers also consider factors such as customer concentration, buyer synergies, deal structure, and the quality of the management team.
The underlying operating questions are nevertheless similar:
- How durable is the recurring revenue? Think GRR
- How quickly is the business growing? Think Rule of 40, bookings and revenue growth
- How much margin and cash flow does that growth produce? Think gross profit and EBITDA
- How efficiently is the company adding ARR? Think CAC Payback and Cost of ARR
The correlation between public software comps and specific metrics help us understand where valuation premiums get generated. Those are the drivers this scorecard is designed to measure.
What the SaaS Exit Score Measures
Exit readiness is not a feeling. You can’t control the buyer’s art. But you can set up your data foundation for success, so the data is not to blame. I am focused on the finance piece here, but we know DD touches all departments.
The exit score is a 0 to 100 score across the drivers a 2026 buyer underwrites, weighted toward how private equity and strategic acquirers assess your software company.
I organize it into four pillars. It maps to my Five Pillar SaaS Metrics framework, so if you already track those metrics or took my course, you are most of the way there.
| Pillar | What it captures | Points |
| Retention quality | NRR, GRR, and the gap between them | 35 |
| Growth and Rule of 40 | Efficient growth, read for composition | 30 |
| Capital efficiency | CAC payback, burn multiple, ARR per FTE | 20 |
| Margin architecture | Software gross margin, ex. one-time revenue | 15 |
The weighting is deliberate. Retention and efficient growth carry the score because that is what moves your valuation multiple.
How to Score Each Pillar
Pillar 1: Retention Quality (35 points)
Why it matters. This gets to heart of the matter. Do we have a true recurring revenue business?
Retention is the compounding engine of a SaaS business. High net revenue retention means your existing customers are worth more this year than last year, before you add a single new logo. That is the closest thing to a growth guarantee a buyer can find.
Software Equity Group Research
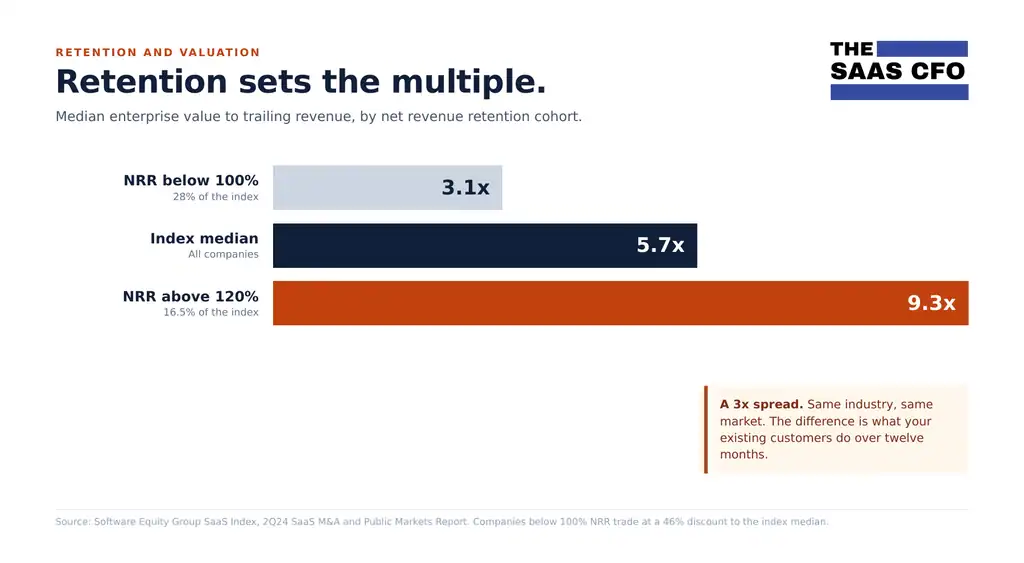
Software Equity Group’s analysis of their own SaaS Index puts the ladder in plain numbers. The 28 percent of index companies with net retention below 100 percent carried a median EV/TTM revenue multiple of just 3.1x, a 46 percent discount to the index median of 5.7x. Every subsequent cohort improved as net retention climbed, and the 16.5 percent of companies above 120 percent net retention reached a median 9.3x. [3] Same industry, same market, roughly a 3x spread in what a dollar of revenue is worth.
McKinsey Research
McKinsey’s research on B2B tech reaches the same place from a different direction, and it names what separated the winners. Their analysis of more than 100 B2B SaaS companies, covering the first quarter of 2019 through the fourth quarter of 2024, found that efficient growth is the factor most correlated with value creation. The top quartile by valuation carried a median enterprise-value-to-revenue multiple of 24x. The bottom quartile carried 5x. [4]
Retention First
So what did the top quartile do differently? Retention, first. Top-quartile-valued companies ran 113 percent NRR against 98 percent for the bottom quartile. [4] Fifteen points of retention, roughly a five-fold difference in value. McKinsey’s companion analysis of 55 B2B SaaS companies adds the other two differences: top-quartile NRR companies posted higher growth efficiency and shorter payback periods than their peers, and they held their premium through both bull and bear markets. [4]
Rule of 40 Still Rules
McKinsey’s Rule of 40 work puts harder numbers on the growth side. Across their top-quartile cohort, median ARR growth ran 45 percent against 14 percent for the bottom quartile, and median NRR ran 130 percent against 104 percent. In a separate cut of 40 public B2B SaaS companies, those at 120 percent NRR or better carried a median EV/revenue of about 21x, against about 9x for everyone below. [16]
Retention, growth, and payback. That is three of the four pillars in this scorecard, and it is not a coincidence. Those are the metrics that separate a 24x company from a 5x one.
What separates a 24x company from a 5x one
- NRR: 113% vs 98%. Top-quartile-valued B2B SaaS against bottom-quartile. Fifteen points of retention, five times the valuation.
- Efficient growth beat growth. Across 100-plus companies, efficient growth was the factor most correlated with value creation. Not growth alone.
- Shorter payback, higher growth efficiency. The same top-quartile NRR companies won on both.
- The premium held in down markets. Top-quartile NRR companies sustained higher valuations through bull and bear cycles.
- Retention, growth, payback. Three of the four pillars in this scorecard.
Bessemer Research
Bessemer makes the underlying point directly. Running a multiple regression on their Cloud Index over the past five to six years, they found the weighting of revenue growth versus free cash flow margin in determining valuation multiples has ranged from about 2x to 9x. [5] In other words, the market does not value a dollar of growth and a dollar of margin equally, which is why Bessemer argues the equal-weighted Rule of 40 is flawed for later-stage businesses. Expansion revenue from your existing base is the cheapest growth you will ever produce, and it is the kind the market rewards.
This is also why Meritech tracks net revenue retention as one of the defining characteristics of best-in-class public software. It has been under pressure. Public NRR sat at a median of 115 percent in September 2023, [6] and it declined through 2025 before stabilizing in the 107 to 109 percent range in 2026. [1] Retention got harder for everyone, which is why your customer cube will be under the microscope.
How to calculate it right. There are several ways to calculate retention. Aggregate. Cohorts. Renewal.
For cohort retention, you need two numbers, not one. For NRR, take a fixed cohort of customers as of 12 months ago, then measure that same cohort’s recurring revenue today, including expansion, contraction, and churn, and exclude every customer you acquired since. The cohort must be fixed.
The lazy version; total ARR today over total ARR a year ago which blends in new sales and skews the number. For GRR, run the same calculation but strip out all expansion. GRR cannot exceed 100%. GRR is one of my favorites. It’s the true health of your customer base.
The common mistake. Reporting NRR alone. Buyers now pair it with GRR and watch the gap. If your NRR is 115 percent and your GRR is 85%, that 30-point gap says you are masking real churn with aggressive expansion. Two different worlds.
A wide gap may hurt your valuation. Gainsight puts the concentration-risk line at a gap above 30 points. [14] The pattern buyers flag the hardest is NRR above 110% with GRR below 85%. Your recurring health may be questioned if GRR is below median benchmarks despite having NRR above 100%.
Grade yourself. In Benchmarkit.ai data, the private mid-market median NRR sits about 100 to 105 percent, and GRR medians land about 84 to 85 percent. [15] SaaS Capital’s 2025 data puts the population median NRR at 101 percent and GRR at 91 percent and calls GRR above 90 percent table stakes just to reach parity with your peers. [7] KeyBanc and Sapphire Ventures 2025 edition reports renewed growth acceleration alongside a sustained focus on profitability. [13] Score the top of this pillar only for NRR above about 115% with GRR above 90% percent.
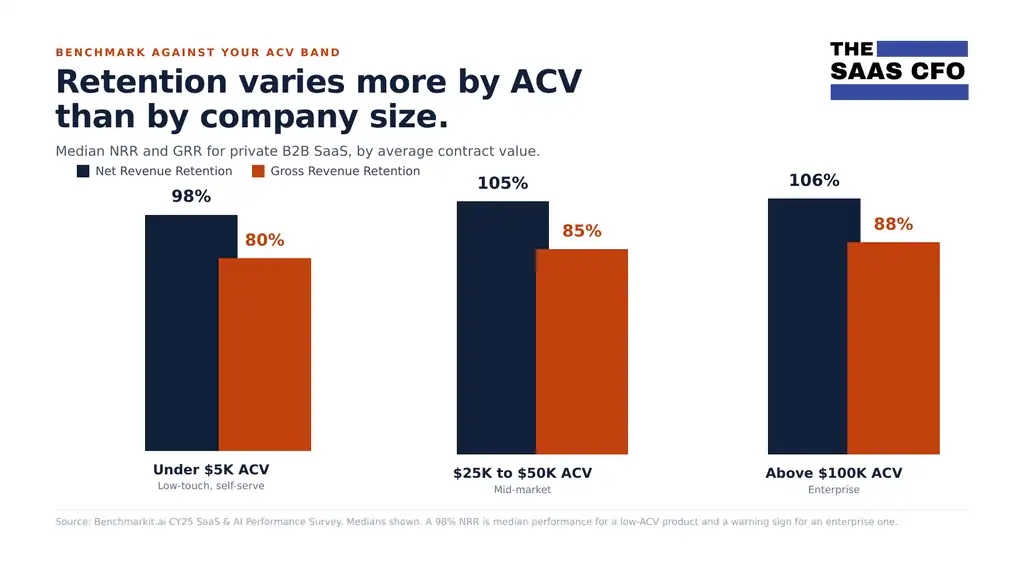
Let’s caveat this. That is B2B. If you target B2C or offer a low price point B2B product, those targets may not fit you. And benchmark yourself against your ACV band, not the population median. Retention varies more by ACV than by anything else, and SaaS Capital says so explicitly. In Benchmarkit’s CY25 data the spread is wide: median NRR runs about 98 percent for products under $5K ACV and about 106 percent above $100K, with GRR running about 80 percent against 88 percent across the same split. [15] A 98 percent NRR is median performance for a low-ACV product and a warning sign for an enterprise one.
Pillar 2: Growth and Rule of 40 (30 points)
Why it matters. Growth is the price of admission. But growth only stopped being enough. The market now pays for the combination of growth and profitability, not either one alone. Ahh, the best of both worlds.
Here is the part almost every founder misses, and Meritech’s data proves it cleanly. Two companies can post the exact same Rule of 40 and be worth very different amounts. In Meritech’s September 2026 analysis, public companies at a similar Rule of 40 traded at about 10.0x when the score was growth-led, versus about 4.1x when it was margin-led. [1] Same score. About 2.4 times the value. Rule of 40 is an outcome but make sure you measure it.
Meritech’s own conclusion is blunt: the market rewards growth above all inside the Rule of 40. They even publish a growth-weighted version of the metric, and their Meritech Rule of 40 correlates to multiple more strongly than either growth alone or the traditional Rule of 40. [1] Composition is everything.
How to calculate it right. Year-over-year ARR growth rate (look at revenue YOY too) plus EBITDA margin. Use EBITDA, not SDE, and not a margin propped up by capitalized development or questionable EBITDA addbacks. Private buyers underwrite on EBITDA and will normalize your addbacks whether you do it first or not.
One note on comparability: Meritech’s public figures use a free-cash-flow-based Rule of 40, while private M&A and your own diligence should use the EBITDA-based version. Do not mix the two. The gap between them is not small. Aventis found the FCF version correlates better with current public multiples, largely because stock-based compensation has widened the distance between GAAP EBITDA and actual cash generation, while the EBITDA version sits closer to economic reality for a private buyer who must fund that compensation with real dilution. [9]
The common mistake. Chasing the score with cost cuts right before a sale, so your 40 is all margin and no growth. Buyers see through it. Aventis found each 10-point improvement in Rule of 40 is worth about a 1.02x turn on the revenue multiple in their deal data, [8] but the growth-led turns are worth far more than the margin-led ones.
Grade yourself. This is a higher bar than it looks. Rule 40 should be hard to hit. In Benchmarkit.ai data, the median Rule of 40 for the 5 million to 20 million ARR band is about 8, with the top quartile about 32. [15] In Aventis’s May 2026 study of 55 publicly listed SaaS companies with enterprise values above $350 million, only about 15 percent cleared the Rule of 40 on an EBITDA basis, against roughly 46 percent on a free-cash-flow basis. [9] So a real, EBITDA-based 40 already puts you near the top of the field. Score full points for a growth-led 40 or better.
Pillar 3: Capital Efficiency (20 points)
Why it matters. Efficiency tells a buyer how much cash they will need to feed the machine after close. Two businesses with identical ARR and growth are not worth the same if one buys that growth at twice the cost. Hence, more capital needs post-acquisition.
How to calculate it right. Three inputs. CAC Payback is fully loaded CAC divided by new customer monthly recurring revenue times gross margin. Burn Multiple is net cash burn divided by net new ARR. ARR per FTE is total ARR divided by full-time headcount, the fastest read on whether the org is bloated. I prefer my ROSE Metric over ARR per FTE. See if you can beat the $1.50 test.
The common mistake. Your CAC is not fully loaded. Your accounting is a mess. You have no customer cube. You don’t allocate between new and existing acquisition for your sales and marketing expenses. You bury benefits and payroll taxes in G&A.
Grade yourself. In Benchmarkit’s data, ARR per employee in the 5 million to 20 million band runs about $155K at the median and about $222K at the top quartile, and a fully loaded CAC payback for a mid-ACV product commonly lands about 17 to 18 months. [15] Payback under 12 months with a burn multiple under 1.0x is premium. In the same dataset the burn multiple runs about 1.0x at the population median, with the top quartile at about 0.4x. [15] Payback over 24 months is work to do before you sell. High payback and low retention is not a good combo.
Pillar 4: Margin Architecture (15 points)
Why it matters. Gross margin sets the ceiling on everything. At 85 percent, every new revenue dollar returns 85 cents of gross profit to cover OpEx and eventually fall to EBITDA. At 55 percent, you may be a services business or an inference heavy AI product, and your multiple will say so. AI margins are still up for debate, but don’t assume you can’t hit typical SaaS margins. Low gross profit is a big anchor to pull. Eventually, you will burn out.
How to calculate it right. Isolate software gross margin: subscription revenue minus subscription COGS over subscription revenue. Subscription COGS includes Support, Customer Success, and Dev Ops.
The common mistake. You only report hosting and inference costs in COGS. Or you leave wages in G&A. Buyers reclass this every time. If you do not do it first, they will, and your margin drops in the middle of diligence. Bad, bad timing. Also, your chart of accounts is a mess. You have not defined COGS vs. OpEx.
Grade yourself. In Ray Rike’s data, subscription gross margin for the 5 million to 20 million band runs about 80 percent at the median and about 86 percent at the top quartile, with the bottom quartile at about 72 percent. [15] Below about 65%, expect a buyer to question your margins and where they are trending.
How the Points are Awarded
Here is the part most readiness scores leave out. If a score cannot be recomputed by someone else from the same inputs, it is an opinion, not a score. So here are the bands.
Pillar 1, Retention quality, 35 points
| NRR | Points | GRR | Points |
| 115% or above | 20 | 92% or above | 15 |
| 110% to 114% | 16 | 88% to 91% | 11 |
| 105% to 109% | 12 | 85% to 87% | 8 |
| 100% to 104% | 8 | 80% to 84% | 4 |
| 95% to 99% | 4 | Below 80% | 0 |
| Below 95% | 0 |
Pillar 2, Growth and Rule of 40, 30 points
The Rule of 40 level is worth 20 points. Composition is worth 10, because the same score earns very different multiples depending on how you got there.
| Rule of 40 (EBITDA basis) | Points | Growth share of score | Points |
| 40 or above | 20 | 60% or more (growth-led) | 10 |
| 30 to 39 | 16 | 40% to 59% (balanced) | 6 |
| 20 to 29 | 11 | Below 40% (margin-led) | 2 |
| 10 to 19 | 6 | ||
| 0 to 9 | 2 | ||
| Below 0 | 0 |
Growth share is your ARR growth rate divided by your Rule of 40 score. A company at 30 percent growth and 10 percent EBITDA margin scores 40, with a growth share of 75 percent. A company at 5 percent growth and 35 percent margin also scores 40, with a growth share of 13 percent. The market does not pay those two the same.
Pillar 3, Capital efficiency, 20 points
| CAC payback | Pts | Burn multiple | Pts | ARR per FTE | Pts |
| Under 12 months | 10 | Under 1.0x | 5 | $222K or above | 5 |
| 12 to 18 months | 7 | 1.0x to 1.5x | 3 | $155K to $221K | 3 |
| 18 to 24 months | 4 | Above 1.5x | 0 | $110K to $154K | 1 |
| 24 to 36 months | 2 | Below $110K | 0 | ||
| Over 36 months | 0 |
Pillar 4, Margin architecture, 15 points
| Subscription gross margin | Points |
| 86% or above | 15 |
| 80% to 85% | 12 |
| 75% to 79% | 8 |
| 70% to 74% | 4 |
| Below 70% | 0 |
Add the four pillars for your base score out of 100. Then apply the deductions below. Deductions are capped at 25 points in total and the score floors at zero, so one data problem cannot wipe out an otherwise strong business. If a metric is missing because you cannot compute it from your own data yet, do not score it as a zero. Drop its points from the denominator, score what you have, and treat the missing input as the first thing to go fix.
Apply the Deal-killer Deductions
A strong score can still hide a problem that overrides it. These are the flags a Quality of Earnings team looks for. Treat each as a deduction, not a footnote. A 90 with a concentration flag is not a 90 to a buyer.
Customer concentration, minus 10.
- If one customer is more than about 15 percent of ARR, or your top five are more than about 25 percent, buyers discount for single-point-of-failure risk. Those thresholds are my own, drawn from conversations rather than a published dataset, and your buyer may use tighter ones.
The leaky bucket, minus 10.
- NRR above 110 percent with GRR below 85 percent.
Services disguised as SaaS, minus 10.
- Subscription gross margin below 70 percent. Or this could be a software product that can’t scale like software.
Peak growth passed, minus 10.
- ARR growth under 15 percent with a Rule of 40 under 25.
Pricing that caps expansion, minus 5.
- Unlimited-usage tiers put a ceiling on your NRR.
The 2026 AI traps, minus 15.
- Buyers now have their AI defensibility checklist.
- Per-seat pricing exposed to seat-contraction, where AI agents do the work of many users and your seat count shrinks.
- Thin-wrapper features that are one API call to a foundation model with no workflow moat, which buyers assume get bundled away for free.
- And AI features built on customer data you cannot prove you have the right to train on, which buyers value at zero because they read as a liability, not a moat.
This risk is real money: Bain reported that one in five strategic buyers walked away from a 2025 deal over concerns about the target’s AI exposure. [10]
I have full post on AI defensibility here.
Turn Your Exit Score into a Valuation Range
Here is what the score is worth. These are 2026 private-market ranges.
The baseline. Private lower-middle-market SaaS trades about 3x to 7x ARR, with a median around 4.5x. [11] Public software is not trading at a premium to that today. Meritech’s overall median implied ARR multiple was 4.2x as of September 11, 2026, down from 4.7x three weeks earlier. [1] The real story in public comps is not the median, it is the spread. Top-10 software multiples have been running near 20x while the median sits near 4x. [1] Same industry, five times the value, and the difference is the metrics in this scorecard.
One caution when you compare numbers across sources. An ARR multiple and a forward-revenue multiple are not interchangeable. ARR is the smaller denominator, so the same company prints a higher number on ARR than on next-twelve-months revenue. Check which one you are reading before you anchor on it.
The premium ladder:
- Score 40 to 64. About 2.5x to 4.0x ARR. Priced as a cash-flow asset. Fix retention and margin before you go to market.
- Score 65 to 84. About 4.5x to 6.5x ARR. Institutional grade. Clean up CAC payback or the GRR floor to push higher.
- Score 85 to 100. About 7x to 9x ARR and up. The data backs this. Companies clearing a Rule of 40 above 50 while holding NRR above 120 percent are closing at 7x to 9x, and the rare few combining 60 percent-plus growth with 130 percent-plus NRR and competing strategic buyers have closed at 10x to 12x, under 5 percent of deals. [12] FE International sees the same, with the Rule of 40 above 50 plus NRR above 120 percent combination consistently commanding 7x or higher. [11]
The single biggest lever in that ladder is retention, and it compounds into growth. SaaS Capital shows growth is exponentially correlated with NRR, and that the companies with the highest NRR report median growth roughly double the population median. [7] A few points of retention move you a full turn or more.
Keep the Exit Score Live
One last point, and it is the one that separates a real score from a quiz. The number only means something if it is computed from your actual data on market-approved definitions and formulas. Avoid the one-time fire drills on your data.
When you feed inflated inputs to an advisor, they price the business on those inputs, you get excited, and then diligence rebuilds the model from your ledger and you face the dreaded valuation retrade. That is how founders lose real money late in a deal. Not because the business was weak, but because the reported numbers and the real numbers were not the same.
Exit readiness is also not a one-time event. It is an operating cadence. Your NRR, Rule of 40, and margins move every month, which means your readiness and your multiple move every month too.
Founders, Did I Lose You?
I live in metrics and data every day. If I threw too many numbers, metrics, and multiples at you, I totally understand. But expectations are high in an exit process. We must level up. If you are going life-changing money, you’ll want a fractional CFO or full-time CFO on your side. And a corporate attorney and investment banker.
It takes a lot of work to create an accurate data foundation and defensible metrics. But this is the gap between companies who show up prepared for due diligence and the stories you hear about failed exits.
That is why I building an exit readiness score into SoftwareMetrics.ai. Connect your data, and it computes every pillar above from your real numbers, grades you against benchmarks for your size, flags the deal-killers a buyer would flag, and updates continuously. Not a quiz you take once. The score a buyer would give you.
If you need help with exit readiness, book a time with me here.
This is not a one and done post. I’ll continue to refine this draft. Please contact me if you disagree or see weird things. Also, this is a slice of due diligence. We know that buyers scrutinize HR, R&D, Legal, Tax, contracts, etc. However, understanding the performance of your business does come from finance data.
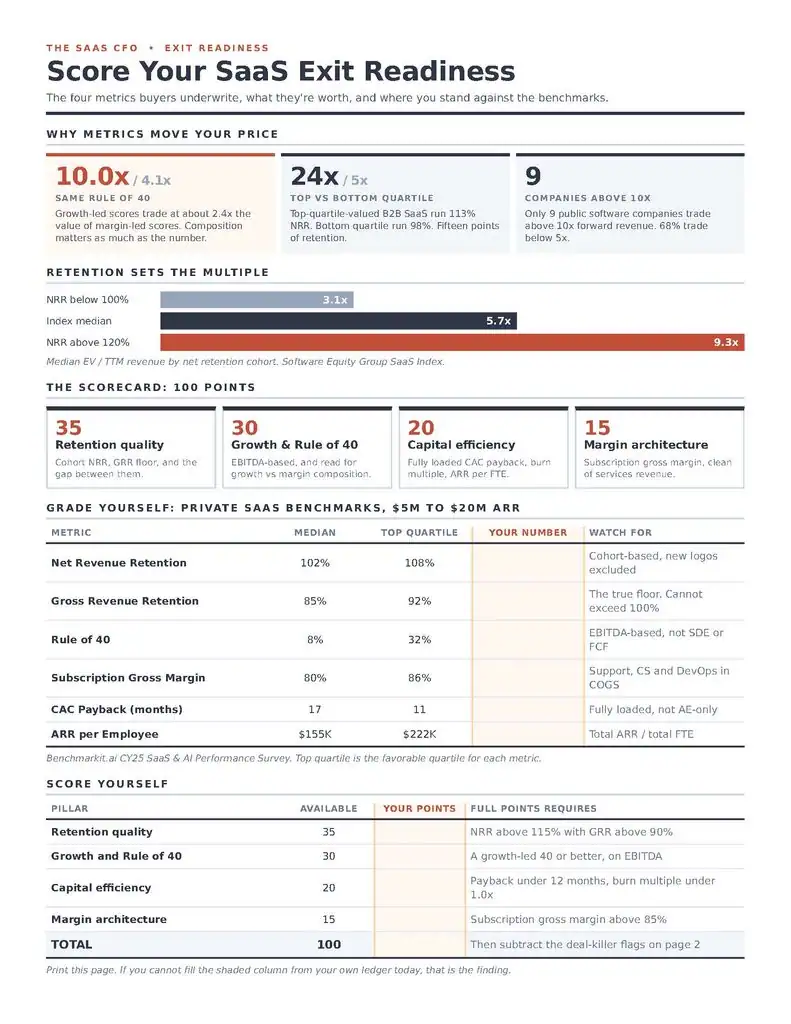
Download the Exit Readiness Calculator and Cheat Sheet Below
Sources
- Meritech Capital, Software Pulse, 11 September 2026. meritech.substack.com/p/meritech-software-pulse-11-september
- Meritech Capital, Software Pulse, 28 August 2026. meritech.substack.com/p/meritech-software-pulse-28-august
- Software Equity Group, How Net Revenue Retention Impacts SaaS Valuation (2Q24 SaaS M&A and Public Markets Report). softwareequity.com/blog/net-retention-public-saas-companies
- McKinsey & Company, The net revenue retention advantage: Driving success in B2B tech, November 19, 2025. mckinsey.com/industries/technology-media-and-telecommunications/our-insights/the-net-revenue-retention-advantage-driving-success-in-b2b-tech
- Bessemer Venture Partners, The Rule of X, BVP Atlas. bvp.com/atlas/the-rule-of-x
- Meritech Capital, Software Pulse, 6 September 2023. meritech.substack.com/p/meritech-software-pulse
- SaaS Capital, 2025 B2B SaaS Retention Benchmarks. saas-capital.com/wp-content/uploads/2025/09/RB32WS1-2025-B2B-SaaS-Retention-Benchmarks.pdf
- Aventis Advisors, SaaS Valuation Multiples: 2015-2026. aventis-advisors.com/saas-valuation-multiples
- Aventis Advisors, Rule of 40 in SaaS: 2026 Data, Benchmarks and Valuation Impact (sample of 55 publicly listed SaaS companies as of 5 May 2026). aventis-advisors.com/rule-of-40-in-saas-2026
- L40 / Bain & Company 2026 M&A data, SaaS Multiples 2026: The Real Private Range. l40.com/insights/saas-multiples
- FE International, SaaS Valuation Multiples in 2026. feinternational.com/blog/saas-valuation-multiples
- Livmo, SaaS Valuation Multiples 2026. livmo.com/blog/saas-valuation-multiples-2026
- KeyBanc Capital Markets and Sapphire Ventures, 16th Annual Private Company SaaS Survey, November 2025. investor.key.com/press-releases
- Gainsight, Net Revenue Retention: How to Calculate NRR with Benchmarks. gainsight.com/blog/net-revenue-retention
- Benchmarkit.ai, CY25 SaaS & AI Performance Survey. Figures cited are for private B2B SaaS in the $5M to $20M ARR band unless noted.
- McKinsey & Company, SaaS and the Rule of 40: Keys to the critical value creation metric. mckinsey.com/industries/technology-media-and-telecommunications/our-insights/saas-and-the-rule-of-40-keys-to-the-critical-value-creation-metric

I have worked in finance and accounting for 25+ years. I’ve been a SaaS CFO for 9+ years and began my career in the FP&A function. I hold an active Tennessee CPA license and earned my undergraduate degree from the University of Colorado at Boulder and MBA from the University of Iowa. I offer coaching, fractional CFO services, and SaaS finance courses.