Gross margin analysis is fundamental to assessing the profitability and overall financial health of your SaaS business. First, we must understand our overall gross profit. Overall gross profit is commonly calculated incorrectly.
Next, we must understand the health of each revenue stream. Each revenue stream’s gross profit contributes to our overall gross profitability.
Margins by revenue stream refer to the amount of profit generated from each revenue stream. This analysis is the second stage of gross profit analysis.
Without this analysis, we do not understand what’s working and what’s not working in the “top half” of our SaaS P&L.
In this post, I’ll explain how I calculate margins by revenue stream. It requires the proper accounting foundation and the proper SaaS P&L setup. Once that’s in place, it’s simple to calculate margins by revenue stream.
SaaS Accounting Foundation
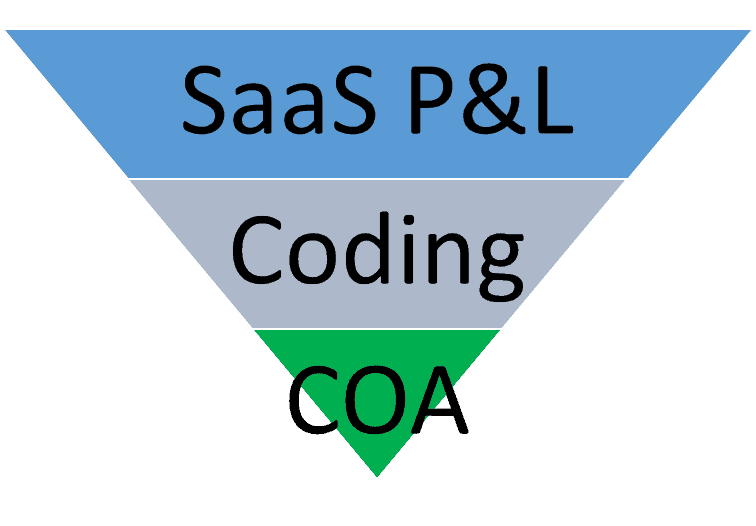
When implementing metrics for SaaS companies, I follow a specific sequence. It starts with your accounting foundation. It must be “SaaSified.”
Whether we are calculating gross profit or calculating CAC, we must have the proper accounting foundation in place.
First, we need the right amount of detail in our chart of accounts (COA). A chart of accounts is a numerical and descriptive listing of all the accounts on your general ledger from the balance sheet to the income statement (aka P&L). The numbers typically start at 1XXXX (can be for 4 or 5-digit) and end at 9XXXXX.
Revenue General Ledger Accounts
Let’s look at revenue first. We need clear and distinct revenue general ledger accounts. These accounts roll up to revenue categories on our SaaS P&L. We do NOT want comingled revenue streams.
The revenue accounts in the picture below represent a simplified version of this structure. It’s important to define distinct revenue accounts. A group of similar accounts creates a revenue category our on P&L.
It’s important to have clear and distinct revenue categories. Don’t mix subscriptions and variable revenue such as usage-based revenue, for example.
We must run our metrics and retention process on each recurring revenue stream. Then we decide if the combined revenue streams tell a better financial story.
These are the common SaaS revenue categories.
- Subscriptions – fixed price MRR or ARR
- Variable – usage, transaction, processing, consumption, etc.
- Professional Services – one-time fees to setup, configure, train, and onboard your customer
- Managed Services – people powered revenue to deliver a “subscriptionized” service.
- Hardware – if you have a hardware component to your offering
- Other – adjustments, conference revenue, etc.

Expense General Ledger Accounts
Next, we need detailed expense definition. We can’t have a big bucket of expenses. All departments must be full-burdened. Meaning, all expenses attributed to that department should be coded to that department.
With expense coding, we have two choices with our COA setup. We can use an inline structure or a dimensional structure. Both have pro’s and con’s.
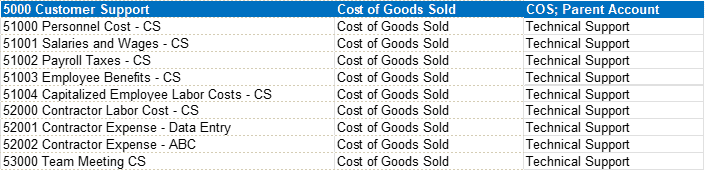
With an inline structure, we create department sections on our chart of accounts.
In the example below, we have the technical support section of our COA. We repeat this structure for each department in our company. It makes our COA longer (multiple wage accounts, for example) but then we can easily create our SaaS P&L.
Our second COA setup option is dimensional. In this setup, we have unique general ledger accounts. In the example below, we have one unique wage account. This setup requires us to define a department structure in our accounting software.
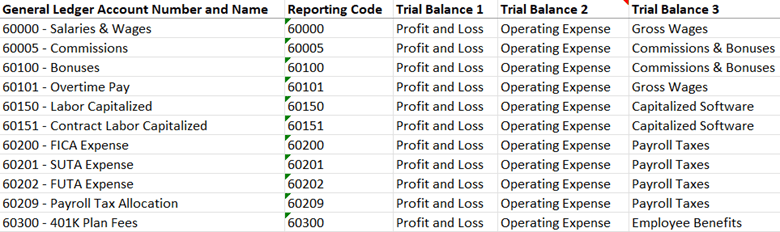
With a dimensional COA, our expense coding during monthly close follows a two-step process. We code the expense to an expense account AND a department.
For pure play SaaS companies, I’d expect the following departments our cost centers.
- Technical Support
- Professional Services
- Customer Success
- Dev Ops
- R&D
- Sales
- Marketing
- G&A
The Proper SaaS P&L Setup
The proper accounting foundation sets us up for success when creating our SaaS P&L. The correct structure supports our coding and monthly close process to create an accurate SaaS P&L.
If we comingle major revenue and expense items in single accounts, we cannot create an accurate SaaS P&L nor perform financial analysis correctly. This leads to inaccurate forecasts and inaccurate SaaS metrics.
There are four major sections to our SaaS P&L. These include revenue, COGS (cost of goods sold), operating expenses (OpEx), and non-operating expenses.
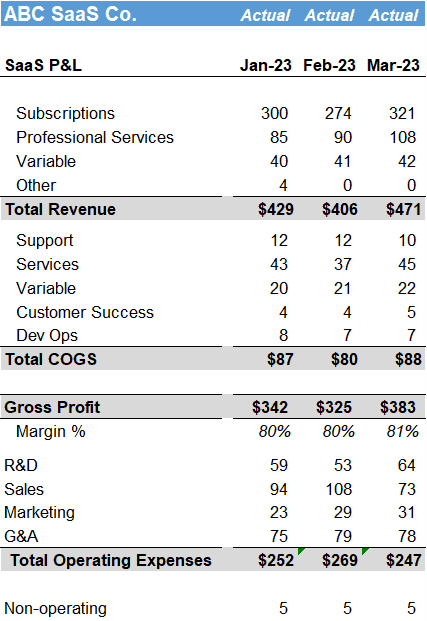
Although there are no standards in SaaS, this SaaS P&L structure will make your Board and investors happy. We map our revenue and expense general ledger accounts to our SaaS P&L categories.
With this setup, we can calculate our accurate overall gross margin and margins by revenue stream. It’s a simple mapping exercise.
SaaS Margins by Revenue Stream
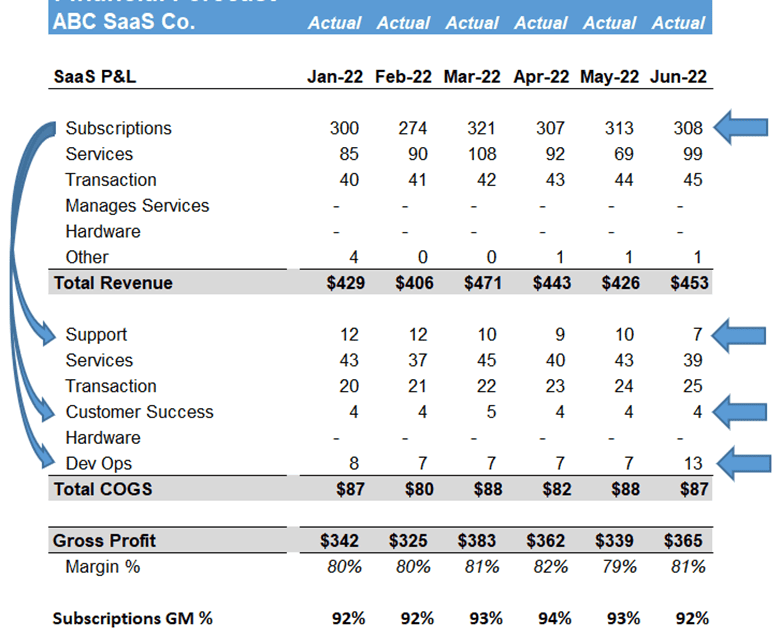
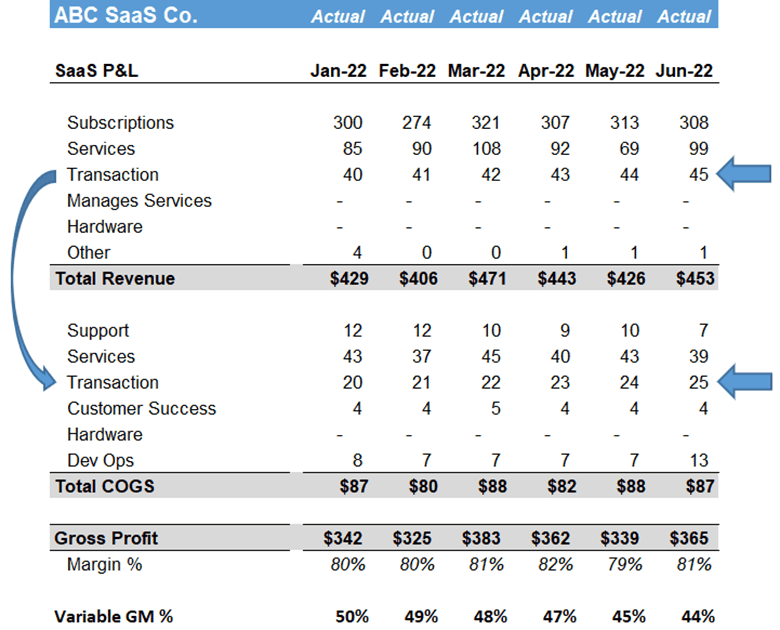
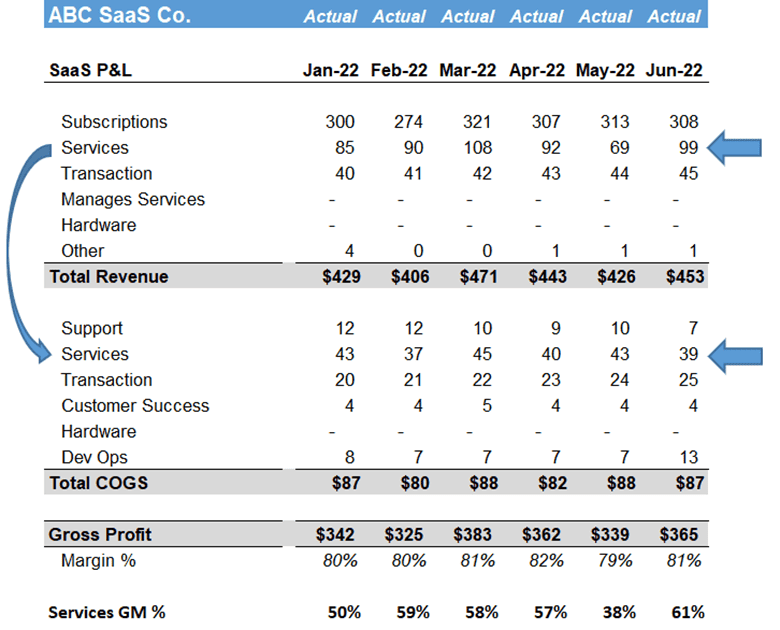
This is the easy part! Our SaaS P&L structure allows us to easily calculate our margins by revenue stream. You can see the mapping below to calculate our subscription margin, services margin, and variable margin.
We have to be careful with variable revenue margins. Variable revenue could include transaction, processing, usage-based, consumption, and so on. Sometimes, our variable revenue is pure profit.
Other times, we have hard expenses associated with delivering variable revenue. For example, if we charge for in-app messaging and use Twilio, we will code Twilio’s charges to our variable expense department.
I like to manage professional services as its own “mini” business unit. Usually, we have a one to one match up here. You do have to consider additional structure if you have a managed services group.
Why is Gross Margin Analysis Important?
Gross profit analysis is fundamental to understanding our financial profile. SaaS companies are so highly valued because they can produce high gross margins.
Best-in-class gross margin is 80%. We must understand where we are in our journey to high gross profit. If our company is scaling and we are struggling with improving our gross margin, it’s a red flag.
If we have multiple revenue streams, we must then understand the profile of each revenue stream. Do we have good subscription gross margins? Poor services margins? Vice versa?
We have to understand what’s working and not working in our business. Margin analysis helps us focus on the areas that need help.
One of the biggest barriers to scaling our SaaS company is low gross profit. It’s so hard to overcome low gross margins unless we have a big cash balance.
Action Items
Where does this leave us? First, do you have your SaaS P&L setup like the above pictures? If yes, great. You are well on your way. If not, follow the steps below.
- Assess your accounting structure. Do you need to SaaSify it?
- Choose an inline or dimensional chart of accounts
- Added the appropriate details and departments
- Map your P&L GL accounts to create your SaaS P&L
I have worked in finance and accounting for 25+ years. I’ve been a SaaS CFO for 8+ years and began my career in the FP&A function. I hold an active Tennessee CPA license and earned my undergraduate degree from the University of Colorado at Boulder and MBA from the University of Iowa. I offer coaching, fractional CFO services, and SaaS finance courses.