There is a metric that I see frequently in the software startup world.
Investors and board members ask: “What is your burn multiple?”
If you do not have a clean answer to that question, let’s get you prepared. If your finance team is not calculating this metric at least quarterly, you are flying blind to one of the most important signals investors use to evaluate your business.
This post breaks down the burn multiple. What it is, where it came from, how to calculate it correctly from your own financials, what the 2026 benchmarks look like by stage, and how it fits into the broader efficiency story you need to be telling.
What Is the Burn Multiple?
The burn multiple was coined by David Sacks, co-founder and general partner of Craft Ventures, in an April 2020 essay titled “The Burn Multiple.”
Sacks built it as an annualized inverse of the older Hype Ratio and Bessemer’s Efficiency Score. His goal was a single number that put the focus squarely on burn relative to growth.
How to Calculate the Burn Multiple
Burn Multiple = Net Burn / Net New ARR
Read this carefully, because this is where many explanations go wrong.
Net Burn is the net cash consumed by the business during the measurement period. It is a cash-flow measure, not the same thing as operating loss or EBITDA. Capitalized software development, capital expenditures, and changes in working capital can cause cash burn to differ materially from the loss reported on the income statement.
In practice, net burn can be calculated from the change in cash after removing financing activity such as equity raises, debt proceeds, and debt repayments. Companies should also consider excluding unusual acquisitions, investment activity, or treasury movements that do not reflect the underlying cost of operating and growing the business.
Sacks intentionally placed cash burn in the numerator because the Burn Multiple is designed to measure how much cash the company consumes to produce each incremental dollar of ARR.
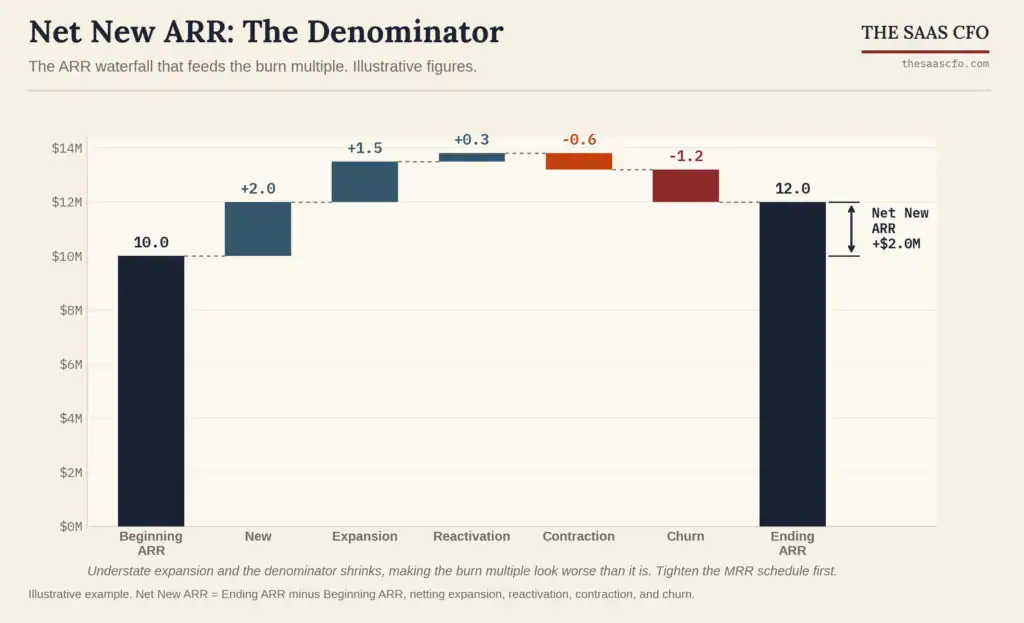
Net New ARR is the increase in ARR during the same measurement period:
Net New ARR = Ending ARR – Beginning ARR
Expressed through an ARR waterfall, that generally equals:
New ARR + Expansion ARR – Contraction ARR – Churn ARR
The numerator and denominator must cover the same month, quarter, or year. Otherwise, the resulting Burn Multiple will not provide a meaningful measure of capital efficiency. I think one month is just too short. I recommend calculating it on a rolling three-month basis.
If you burned $2 million in a quarter and added $1 million in net new ARR, your burn multiple is 2.0x. You spent $2 to generate $1 of new recurring revenue. Sacks calls that reasonable for an early-stage company. If you burned $5 million to add that same $1 million, your burn multiple is 5.0x, which in his words is terrible, and you should probably cut costs immediately. That company is spending like a later-stage business without delivering later-stage growth.
The lower the number, the more efficient the growth.
Why the Burn Multiple Is a Catch-All Metric
Sacks argues the burn multiple is a proxy for almost everything else in the business, because any serious problem eventually shows up in it.
A gross margin problem raises burn as you scale. A sales efficiency problem raises burn relative to new ARR. A churn problem nets against the denominator, so the multiple climbs. For S&M GTM, if you are not measuring the Cost of ARR, do it now.
A stalling growth problem tempts you to discount and spend more on promotions, which lands in a higher multiple. This is why investors reach for it. One number, hard to game. Of course, the inputs to the formula could be gamed easily here.
Why Burn Multiple Matters More Than Ever in 2026
From 2020 to 2021, cheap capital made growth the only metric that mattered. Remember the “rule of 40 is dead” mantra? Burn multiples above 3x were tolerated, sometimes celebrated, as long as the top line was moving. Then rates rose, the SaaS crash hit, and the market recalibrated fast.
Sacks predicted the shift in the original essay. In a tough fundraising environment, it is not just growth but the efficiency of growth that gets scrutinized. Startups whose burn is too high relative to their growth find it hard to raise. That is exactly the world we are in now. The bar is higher in 2026.
Three reasons the market settled on this metric as the key efficiency signal:
- It captures total company efficiency. The Magic Number attempts to measure sales efficiency. The CAC Payback Period measures go-to-market ROI. Burn multiple captures everything. R&D, operations, headcount, G&A, relative to how much new ARR you generate. It is the most complete efficiency signal available. I’d argue my ROSE Metric is pretty good too in this area.
- It works at every stage. LTV to CAC is noisy early before you have enough volume of customer acquisition. Rule of 40 is hard to interpret when you are in the early stages; it’s easy to hit. Burn multiple gives you a clean read from early revenue through IPO.
- It predicts survivability. Companies burning cash faster than they generate new ARR face a compressing runway before their next raise. That is structural.
2026 Burn Multiple Benchmarks by Stage
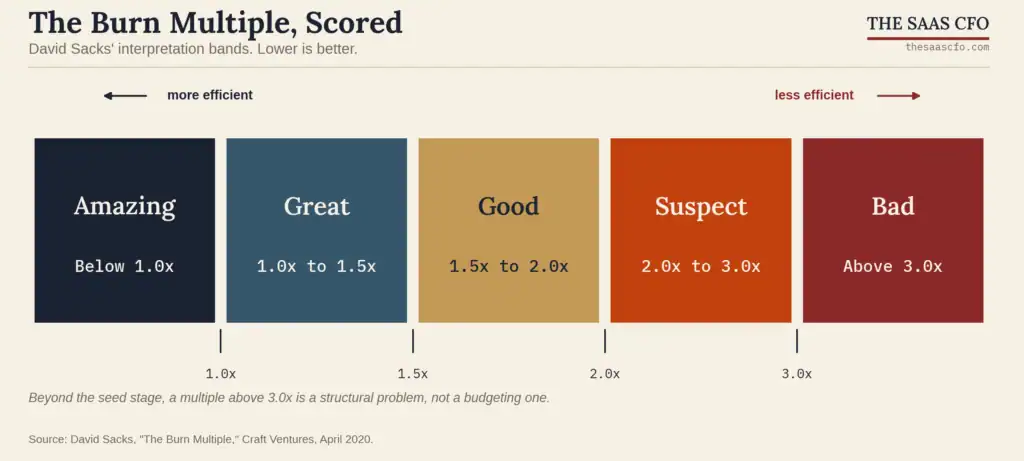
Start with Sacks’ original interpretation bands. These are the rules of thumb from the 2020 essay and they remain the reference point investors use.
| Burn Multiple | Read |
| Below 1.0x | Amazing |
| 1.0x to 1.5x | Great |
| 1.5x to 2.0x | Good |
| 2.0x to 3.0x | Suspect |
| Above 3.0x | Bad |
Sacks also framed the metric as stage-dependent. It should improve as you mature. A seed company might run a burn multiple around 3x because it just started selling. After the Series A it should drop toward 2x. After the Series B, when the sales engine is at scale, expectations tighten further.
Eventually, for a company to reach profitability, burn reaches 0, which means the burn multiple approaches 0 over time. If the multiple is moving the wrong way as you scale, something is wrong, even if headline growth still looks fine. That’s where my 5 Pillar SaaS Metrics Framework can help you find what’s not working.
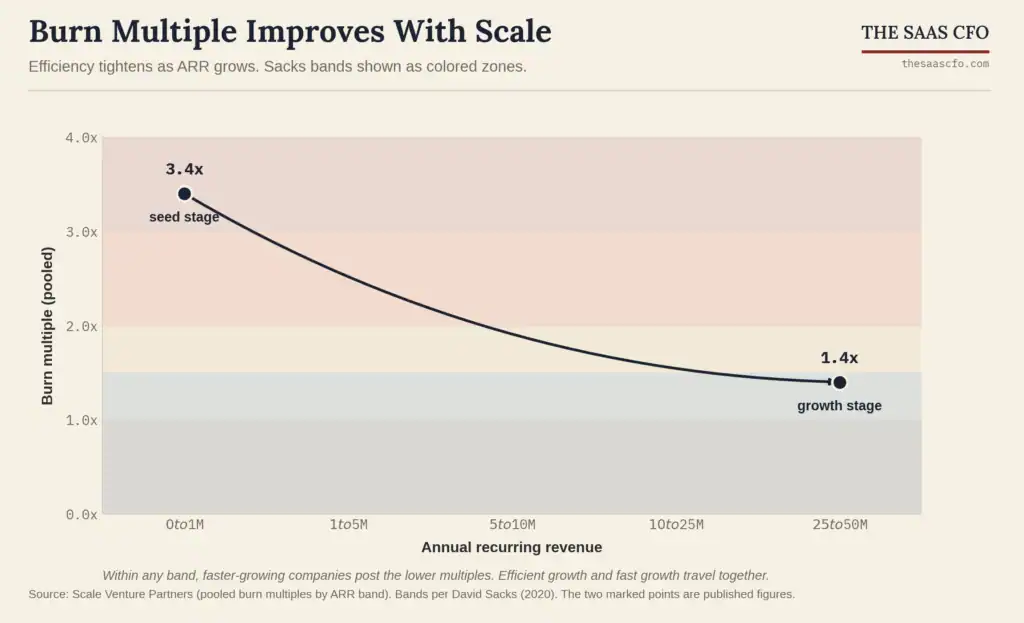
Scale Venture Partners analyzed its portfolio and public comps and found burn multiples improve steadily with size. Companies with $0 to $1 million in ARR run a pooled average burn multiple around 3.4x, while companies with $25 million to $50 million in ARR run around 1.4x. Scale also found a counterintuitive result worth internalizing. Within any given ARR band, the higher-growth companies have the better, lower burn multiples. Efficient growth and fast growth are not a tradeoff. They travel together in the exit row.
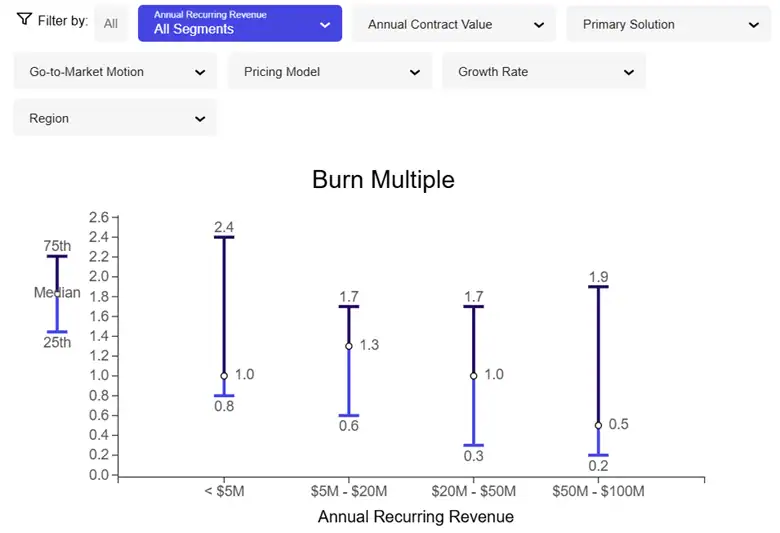
If you want to slot in tighter stage cutoffs, use your own benchmark set rather than round numbers. The Benchmarkit CY25 data is a great data source for stage-specific figures you can defend.
How to Calculate the Burn Multiple from Your Financials
This is where teams get stuck, so here is the mechanical version.
Net New ARR comes from your MRR schedule, not your P&L. Take ending ARR minus beginning ARR for the period. That figure must already net out expansion, contraction, and churn by cohort time period. If your schedule understates expansion, your net new ARR is too low and your burn multiple looks worse than reality.
Net Burn was not really defined in Sacks’ original post. I’d lean on your cash flow statement, not your income statement, to find your net burn number. I’d look at cash flow from operations with a couple caveats. Or run a cash-basis P&L.
If you capitalize software development costs, the related cash outflow will generally appear in investing activities rather than operating activities. Therefore, calculating Net Burn from operating cash flow alone can materially understate the cash consumed by the business. Capitalized software development and other recurring capital expenditures should generally be included in Net Burn.
Pick a window and stay consistent. You can compute it on a single quarter, or on a trailing twelve months. TTM smooths out lumpy quarters but might be too long of a time period. Quarterly annualized reacts faster and is useful for catching a turn early. Whichever you choose, keep it consistent quarter over quarter, and put it on your monthly finance dashboard so you can watch the trend.
What Efficient Growth Looks Like Right Now
The best public operators are threading growth and efficiency at the same time. None of the three below is meaningfully burning cash anymore, so their burn multiples are effectively zero or negative. They are not burn multiple case studies. They are the destination: the point where the multiple has collapsed toward zero and growth continues anyway.
Klaviyo reported 28% revenue growth to $358 million in Q1 2026, with NRR of 110% and revenue per employee above $600,000, up more than 25% year over year. Strong top-line momentum without proportional headcount expansion.
HubSpot grew revenue 23% in Q1 2026 and guided to a 21% non-GAAP operating margin for the full year, hitting its 2027 margin target a year early.
Twilio posted 20% reported revenue growth in Q1 2026, its fastest organic rate since 2022 at 16%, while expanding non-GAAP income from operations 31% year over year to a record $279 million.
In each case the underlying dynamic is the same. More ARR generated per dollar of operating cost.
The aggregate confirms the shift. Blossom Street Ventures tracks the 47 non-distressed SaaS companies that have gone public since Q4 2017. As of Q4 2025, 47% of them generate an operating profit, median net dollar retention is 110%, and on a median basis these companies produce $1.27 of incremental revenue for every $1 of operating loss. The median payback period is 0.8 years. The financial profile is improving even as growth has settled into the high teens.
The Cautionary Tale
Here is the flip side, and it is worth studying because it shows what the metric is really warning you about.
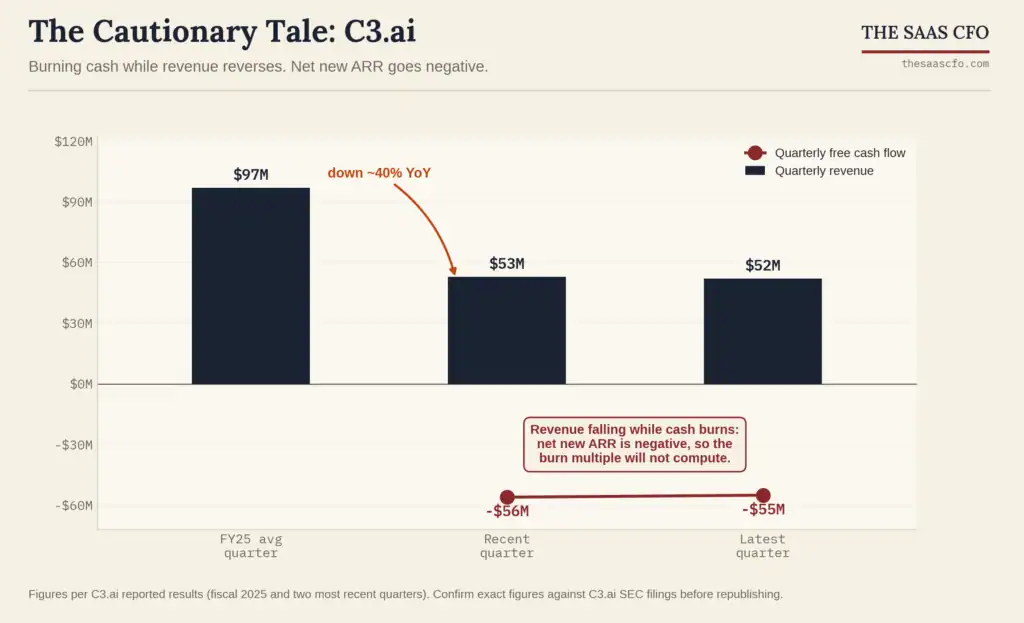
C3.ai spent years as one of the highest-spend names in enterprise software. For fiscal 2025, ended April 30, 2025, it reported $389 million in revenue, up 25%. On the surface that looked like growth worth funding.
Then sales execution broke down. In its two most recently reported quarters, C3.ai reported quarterly revenue of roughly $51 million to $53 million, down about 40% year over year, with billings down 39%, while burning roughly $55 million of free cash flow per quarter. Management replaced the CEO in September 2025 and launched a restructuring aimed at cutting about $135 million of annualized cash burn.
Run the burn multiple logic on that. When revenue is going backwards, net new ARR is negative. There is no positive burn multiple to compute, because the denominator has gone the wrong way. Sacks noted that at zero net new ARR the ratio will not even calculate. C3.ai blew past zero. It was spending heavily to generate negative growth, which is the exact failure the metric exists to catch early. The efficiency signal did not fail here. It was probably flashing red on some internal dashboard.
The broader lesson is that clean public examples of high burn multiples are getting rare. The 2022 reset pushed most public SaaS companies toward positive free cash flow, so the truly ugly burn multiples now live mostly in private markets and in cases like C3, where the problem is not just inefficiency but shrinkage.
And it will be interesting to see what happens to the startups funded during easy money times and high valuations.
Burn Multiple vs. The Metrics You Already Track
If you already run a SaaS P&L with my Five Pillar Framework, the burn multiple slots in as your macro efficiency check on top of everything else. And use my ROSE Metric.
Versus Magic Number. The Magic Number measures sales efficiency but slightly more than that as I explain in my SaaS Metrics Foundation course. Burn multiple captures the whole company. A company can post a healthy 1.2 Magic Number while running a 3x burn multiple because it is over-investing in R&D or G&A or name your cost center. The Magic Number will not tell that story. The burn multiple will.
Versus CAC Payback. CAC payback period tells you how long it takes to recover the upfront cost of acquiring a customer. Burn multiple tells you how much you are spending to grow the overall ARR base. CAC payback is the go-to-market check. Burn multiple is the whole company check.
Versus Rule of 40. Rule of 40, growth rate plus EBITDA margin at or above 40%, is still the standard for valuation narratives. But it requires a stage where margin and ARR size are meaningful. For companies still burning, burn multiple is the more accurate real-time read. There are lovers and haters of the Rule of 40. Blossom Street Ventures, whose data appears above, publicly calls it outdated. Use Rule of 40 for investor comparisons, use burn multiple for internal operating decisions. I still like the Rule of 40 for financial discipline discussions.
How to Improve Your Burn Multiple
There are two sides to the equation. The burn and the net new ARR. Most companies reach for headcount cuts on the burn side. That works, but it is slow and painful. The faster lever is often on the ARR side.
Clean up your ARR calculation first. If net new ARR is understated because you are not capturing expansion correctly, your burn multiple looks worse than it is. Tighten the MRR schedule. Every dollar of expansion, contraction, and churn accounted for by cohort.
Audit your cost to grow. Break down operating expenses by function relative to net new ARR generated. Where is spending least correlated with ARR growth?
Focus retention on high-ACV accounts. Churn hits the net new ARR side through contraction. A one-point improvement in gross dollar retention on your largest accounts can move net new ARR without adding a dollar of cost.
Prioritize expansion revenue. Expansion ARR is the highest-efficiency growth you can generate. It costs a fraction of new customer acquisition. Companies with NRR above 110% achieve dramatically better burn multiples at equivalent growth rates, because the expansion engine subsidizes new customer acquisition.
Track it monthly. If your burn multiple is degrading, trending from 1.3x to 1.6x to 2.1x over three quarters, that is an early warning worth addressing before it becomes a fundraising or cash conversation.
The Benchmark Your Board Wants to See
When a board asks about capital efficiency, come in with three numbers. Gross margin, burn multiple, and the ROSE Metric. These are foundational metrics. Together they tell the full story of how efficiently you grow and how long the growth machine can sustain itself.
The bar, using Sacks’ bands:
- Below 1.0x is amazing. You generate more in new ARR than you burn.
- 1.0x to 1.5x is great. Where well-run growth-stage companies should sit.
- 1.5x to 2.0x is good but should be monitored.
- 2.0x to 3.0x is suspect and needs a clear trajectory toward improvement.
- Above 3.0x beyond the seed stage is a structural problem, not an execution problem. The business model needs attention, not just the budget.
The shift from grow at all costs to grow efficiently is not a cycle. It is a permanent reset. The companies winning right now have internalized that efficiency and growth are not tradeoffs. Efficiency enables faster growth by extending runway, improving margins, and making every dollar of capital work harder.
The burn multiple is how you measure whether you are living that truth or just talking about it.
Takeaways
- Burn multiple equals net burn divided by net new ARR. It was coined by David Sacks at Craft Ventures in 2020. The lower the better.
- Net burn is cash burned, not your GAAP operating loss. Pull it from the cash flow statement.
- Sacks’ bands: below 1.0x amazing, 1.0x to 1.5x great, 1.5x to 2.0x good, 2.0x to 3.0x suspect, above 3.0x bad.
- Benchmarks improve with scale. Roughly 3.4x at $0 to $1 million ARR, around 1.4x at $25 million to $50 million ARR, per Scale Venture Partners.
- The fastest lever to improve it is often expansion ARR, not headcount reduction.
- Track it monthly alongside CAC payback for a complete efficiency picture.
Want to go deeper on building the financial foundation to track metrics like these at scale? Explore the courses at The SaaS Academy, and pull your burn multiple straight from your live data at SoftwareMetrics.ai.

I have worked in finance and accounting for 25+ years. I’ve been a SaaS CFO for 9+ years and began my career in the FP&A function. I hold an active Tennessee CPA license and earned my undergraduate degree from the University of Colorado at Boulder and MBA from the University of Iowa. I offer coaching, fractional CFO services, and SaaS finance courses.