
AI agents are doing real work now. They are resolving support tickets, updating CRM records, drafting journal entries, reviewing contracts, and shipping code. The inference bills are growing. Productivity gains are improving. The org chart mix is shifting to digital labor.
But most SaaS and AI companies still cannot report the work their AI is doing. The default metric became tokens. Tokens are useful for cost management, but they are a weak business metric. A CFO does not care that your AI product processed 9 billion tokens last quarter. The CFO wants to know what the AI achieved and whether it returned ROI.
That is the measurement gap. And it is not a theoretical issue. It affects pricing, gross margin, Board reporting, customer ROI, renewals, and investor diligence.
If your AI product creates value, but you can only report seats, logins, and tokens, you are under-reporting value creation. Investor expectations are much higher now. If your AI product consumes a lot of compute, but does not produce measurable work, you may have a margin problem disguised as innovation.
This post is designed as a tactical guide from the product delivery side to your customers. I outline a four-layer framework, walk through how some public tech leaders are measuring AI work, build out a worked unit economics example for an AI support product, share a sample CFO dashboard, and close with three things you can do this week.
AI is doing the work. We need to count it correctly.
The Four Layers of AI Measurement
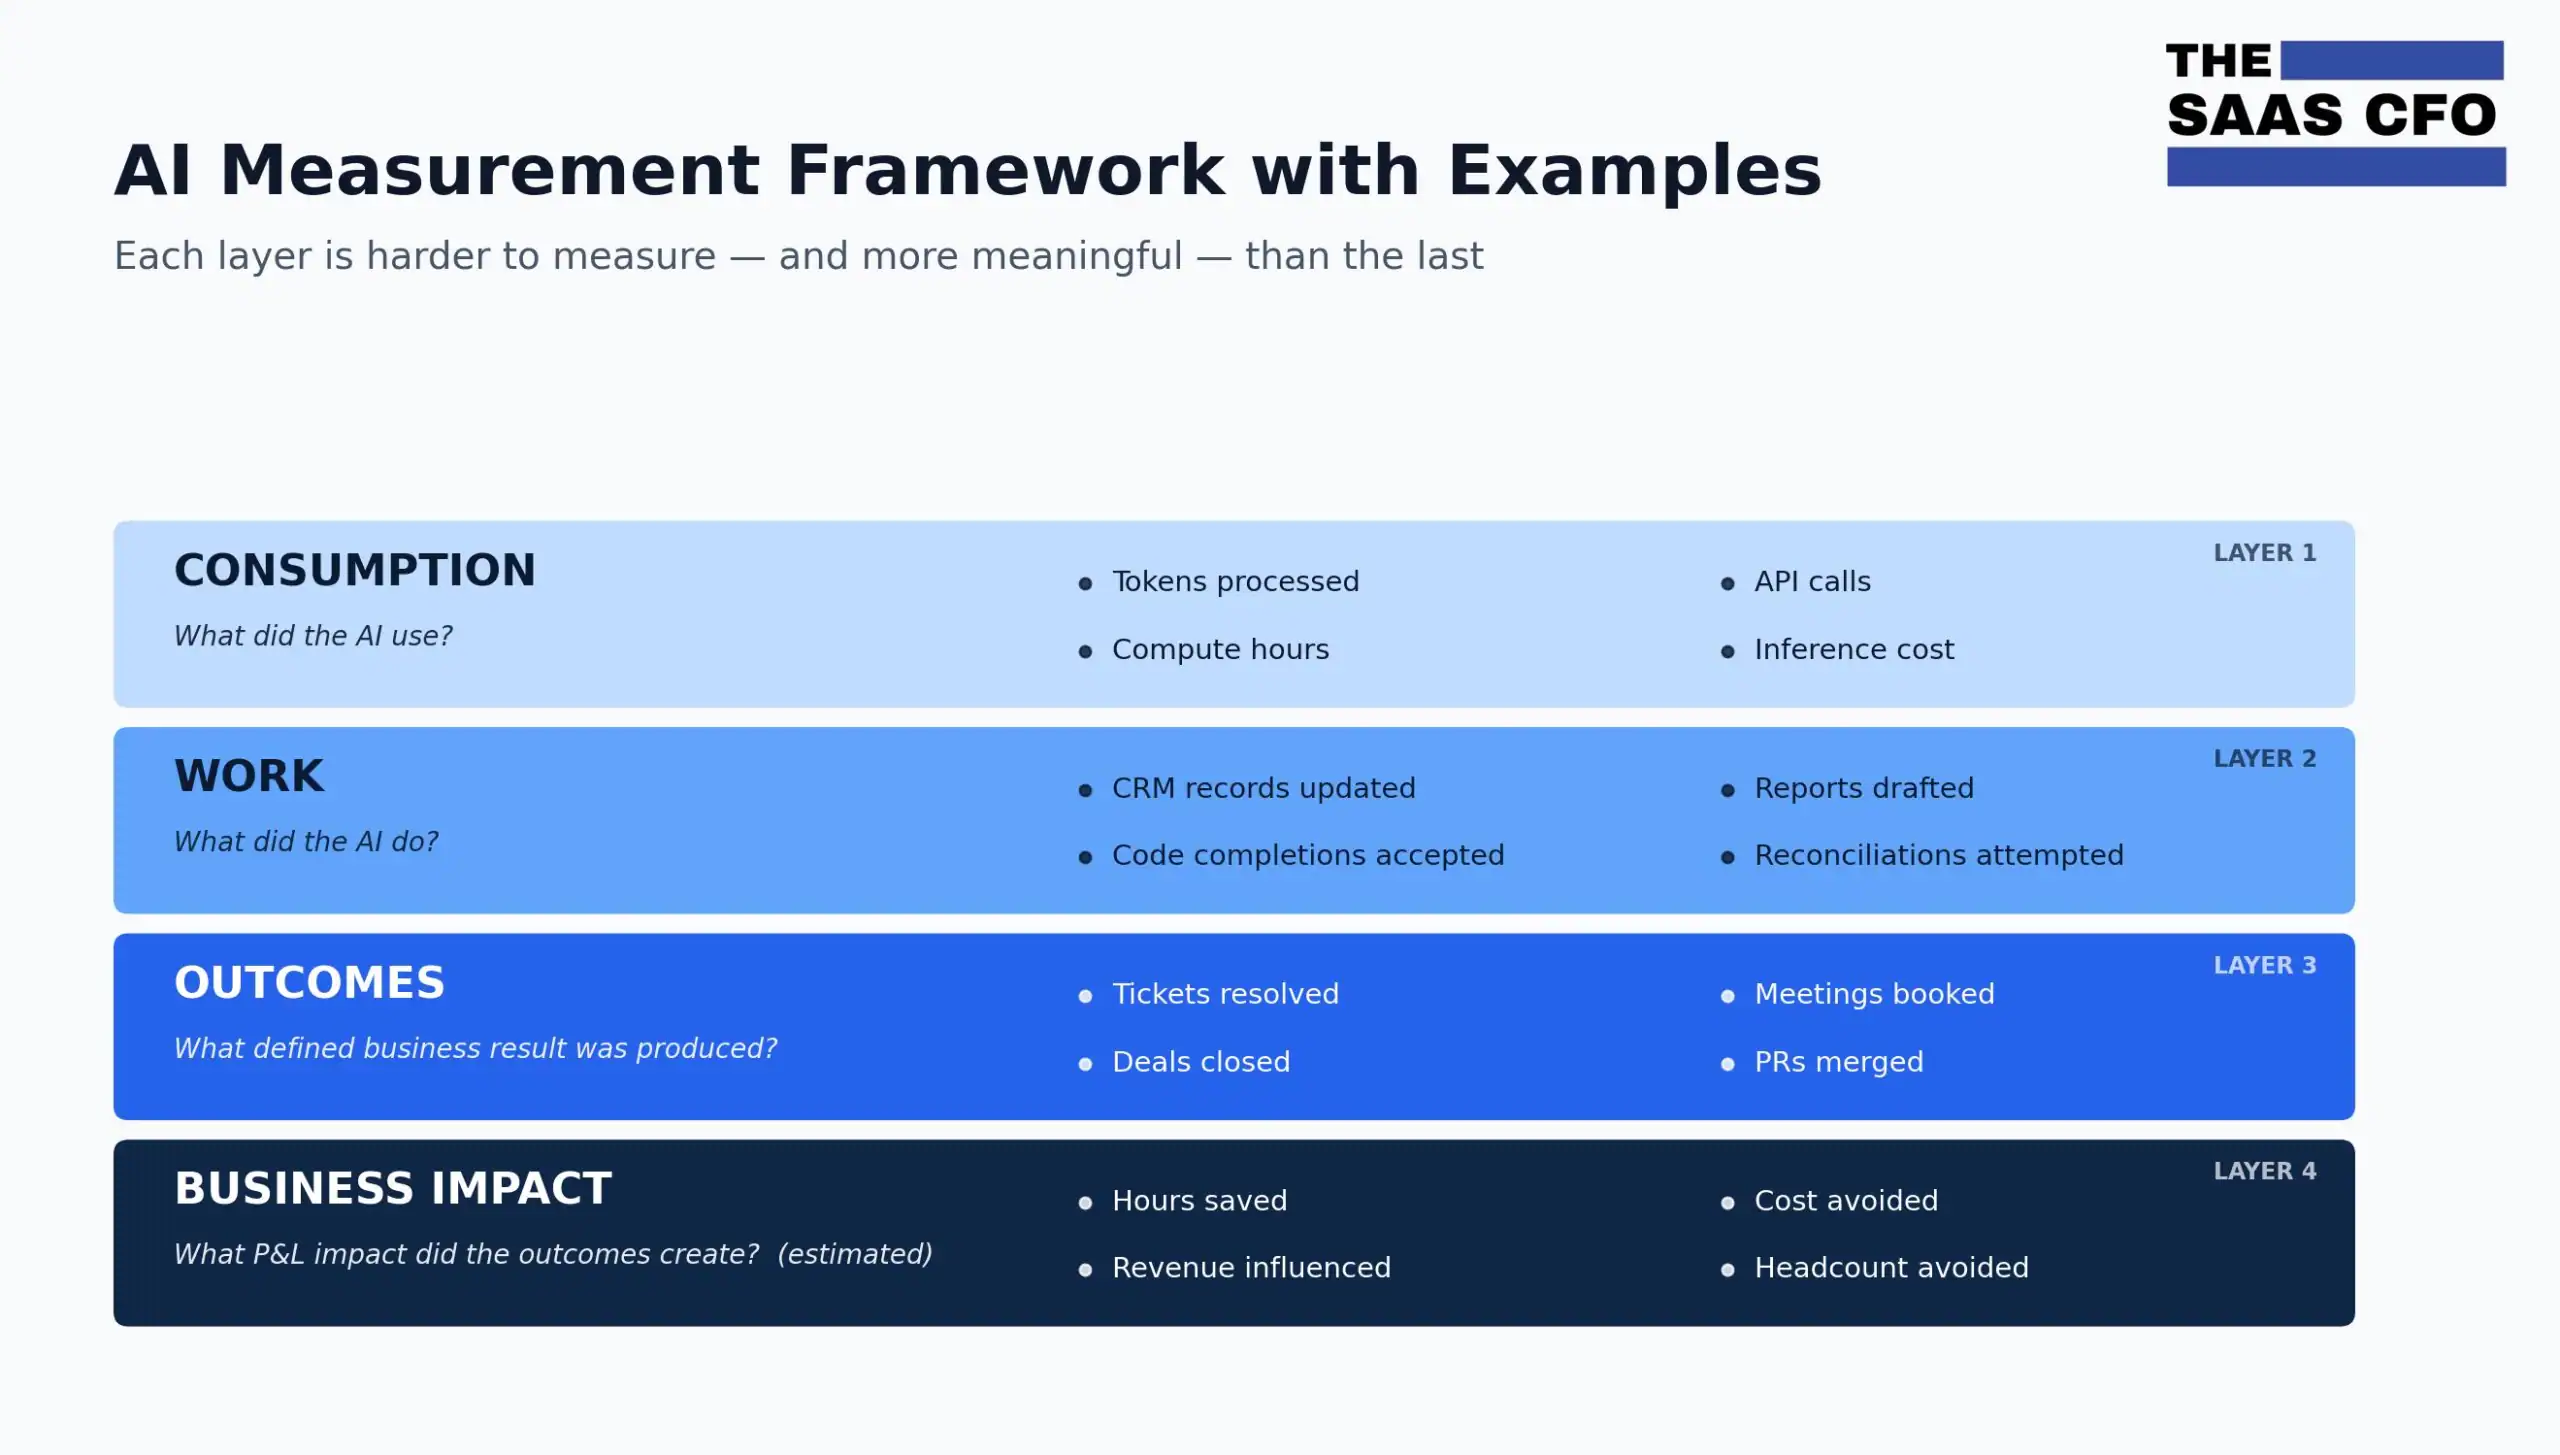
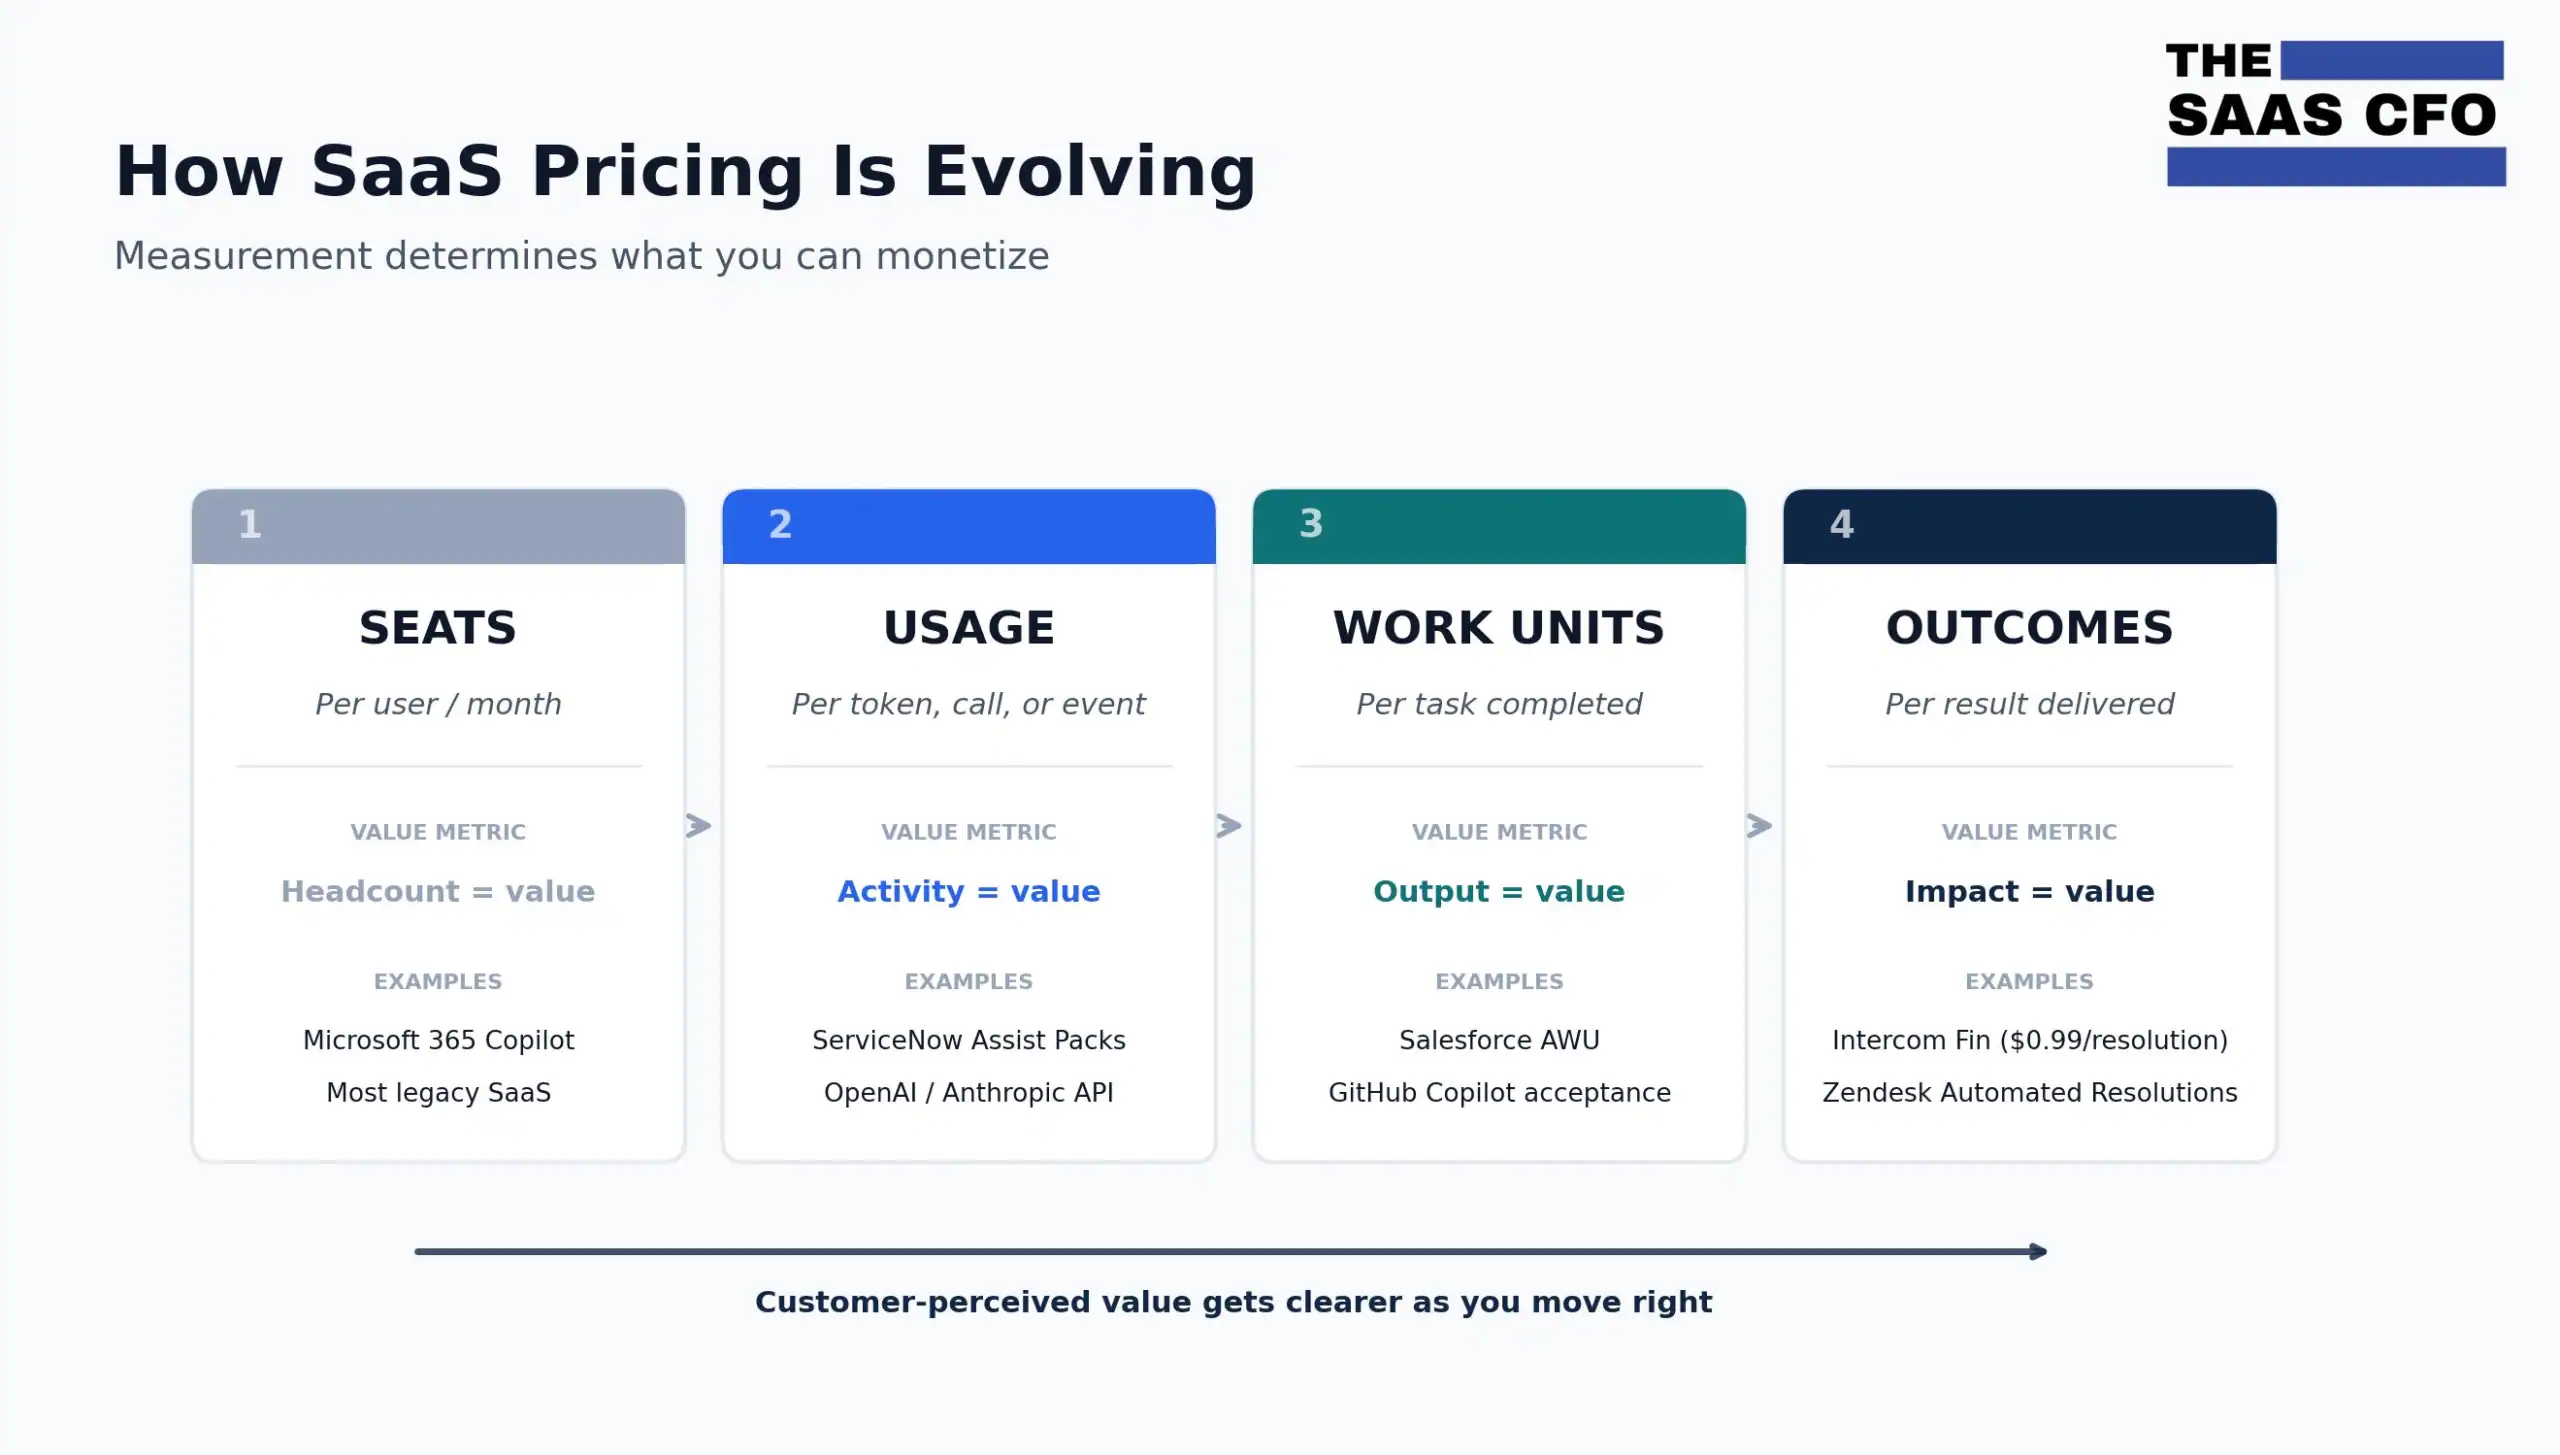
I propose segmenting AI measurement into four layers: consumption, work, outcomes, and business impact. This is the framework I would use in any SaaS reporting package where AI is becoming material to our product roadmap and recurring revenue.
Layer 1 is consumption. What did the AI use? Tokens, API calls, compute hours, and inference costs. These metrics matter for finance and product, especially when AI sits in COGS for revenue delivery. But they are not enough for customers, boards, or investors.
Layer 2 is work. What did the AI do? CRM records updated, reports drafted, code completions accepted, reconciliations attempted, journal entries posted, workflows triggered. These are countable actions the AI performed. You know the work happened. You do not yet know whether it mattered to the business. This is where most companies should start because it is the easiest to instrument.
Layer 3 is outcomes. What defined business result did the AI produce? Tickets resolved, demo meetings booked, qualified leads created, deals closed, PRs merged. An outcome is a work unit that has been verified to produce a defined business result. You can count it AND it has clear business meaning. This is where outcome-based pricing lives.
Layer 4 is business impact. What P&L effect did those outcomes create for the customer? Hours saved, cost avoided, headcount avoided, revenue influenced, pipeline generated, gross margin improvement, renewal lift, CSAT improvement. Business impact is much easer to calculate when you can anchor it out defined outcomes. This is what customers, boards, and investors actually want to see — but only after the layers below it are working.
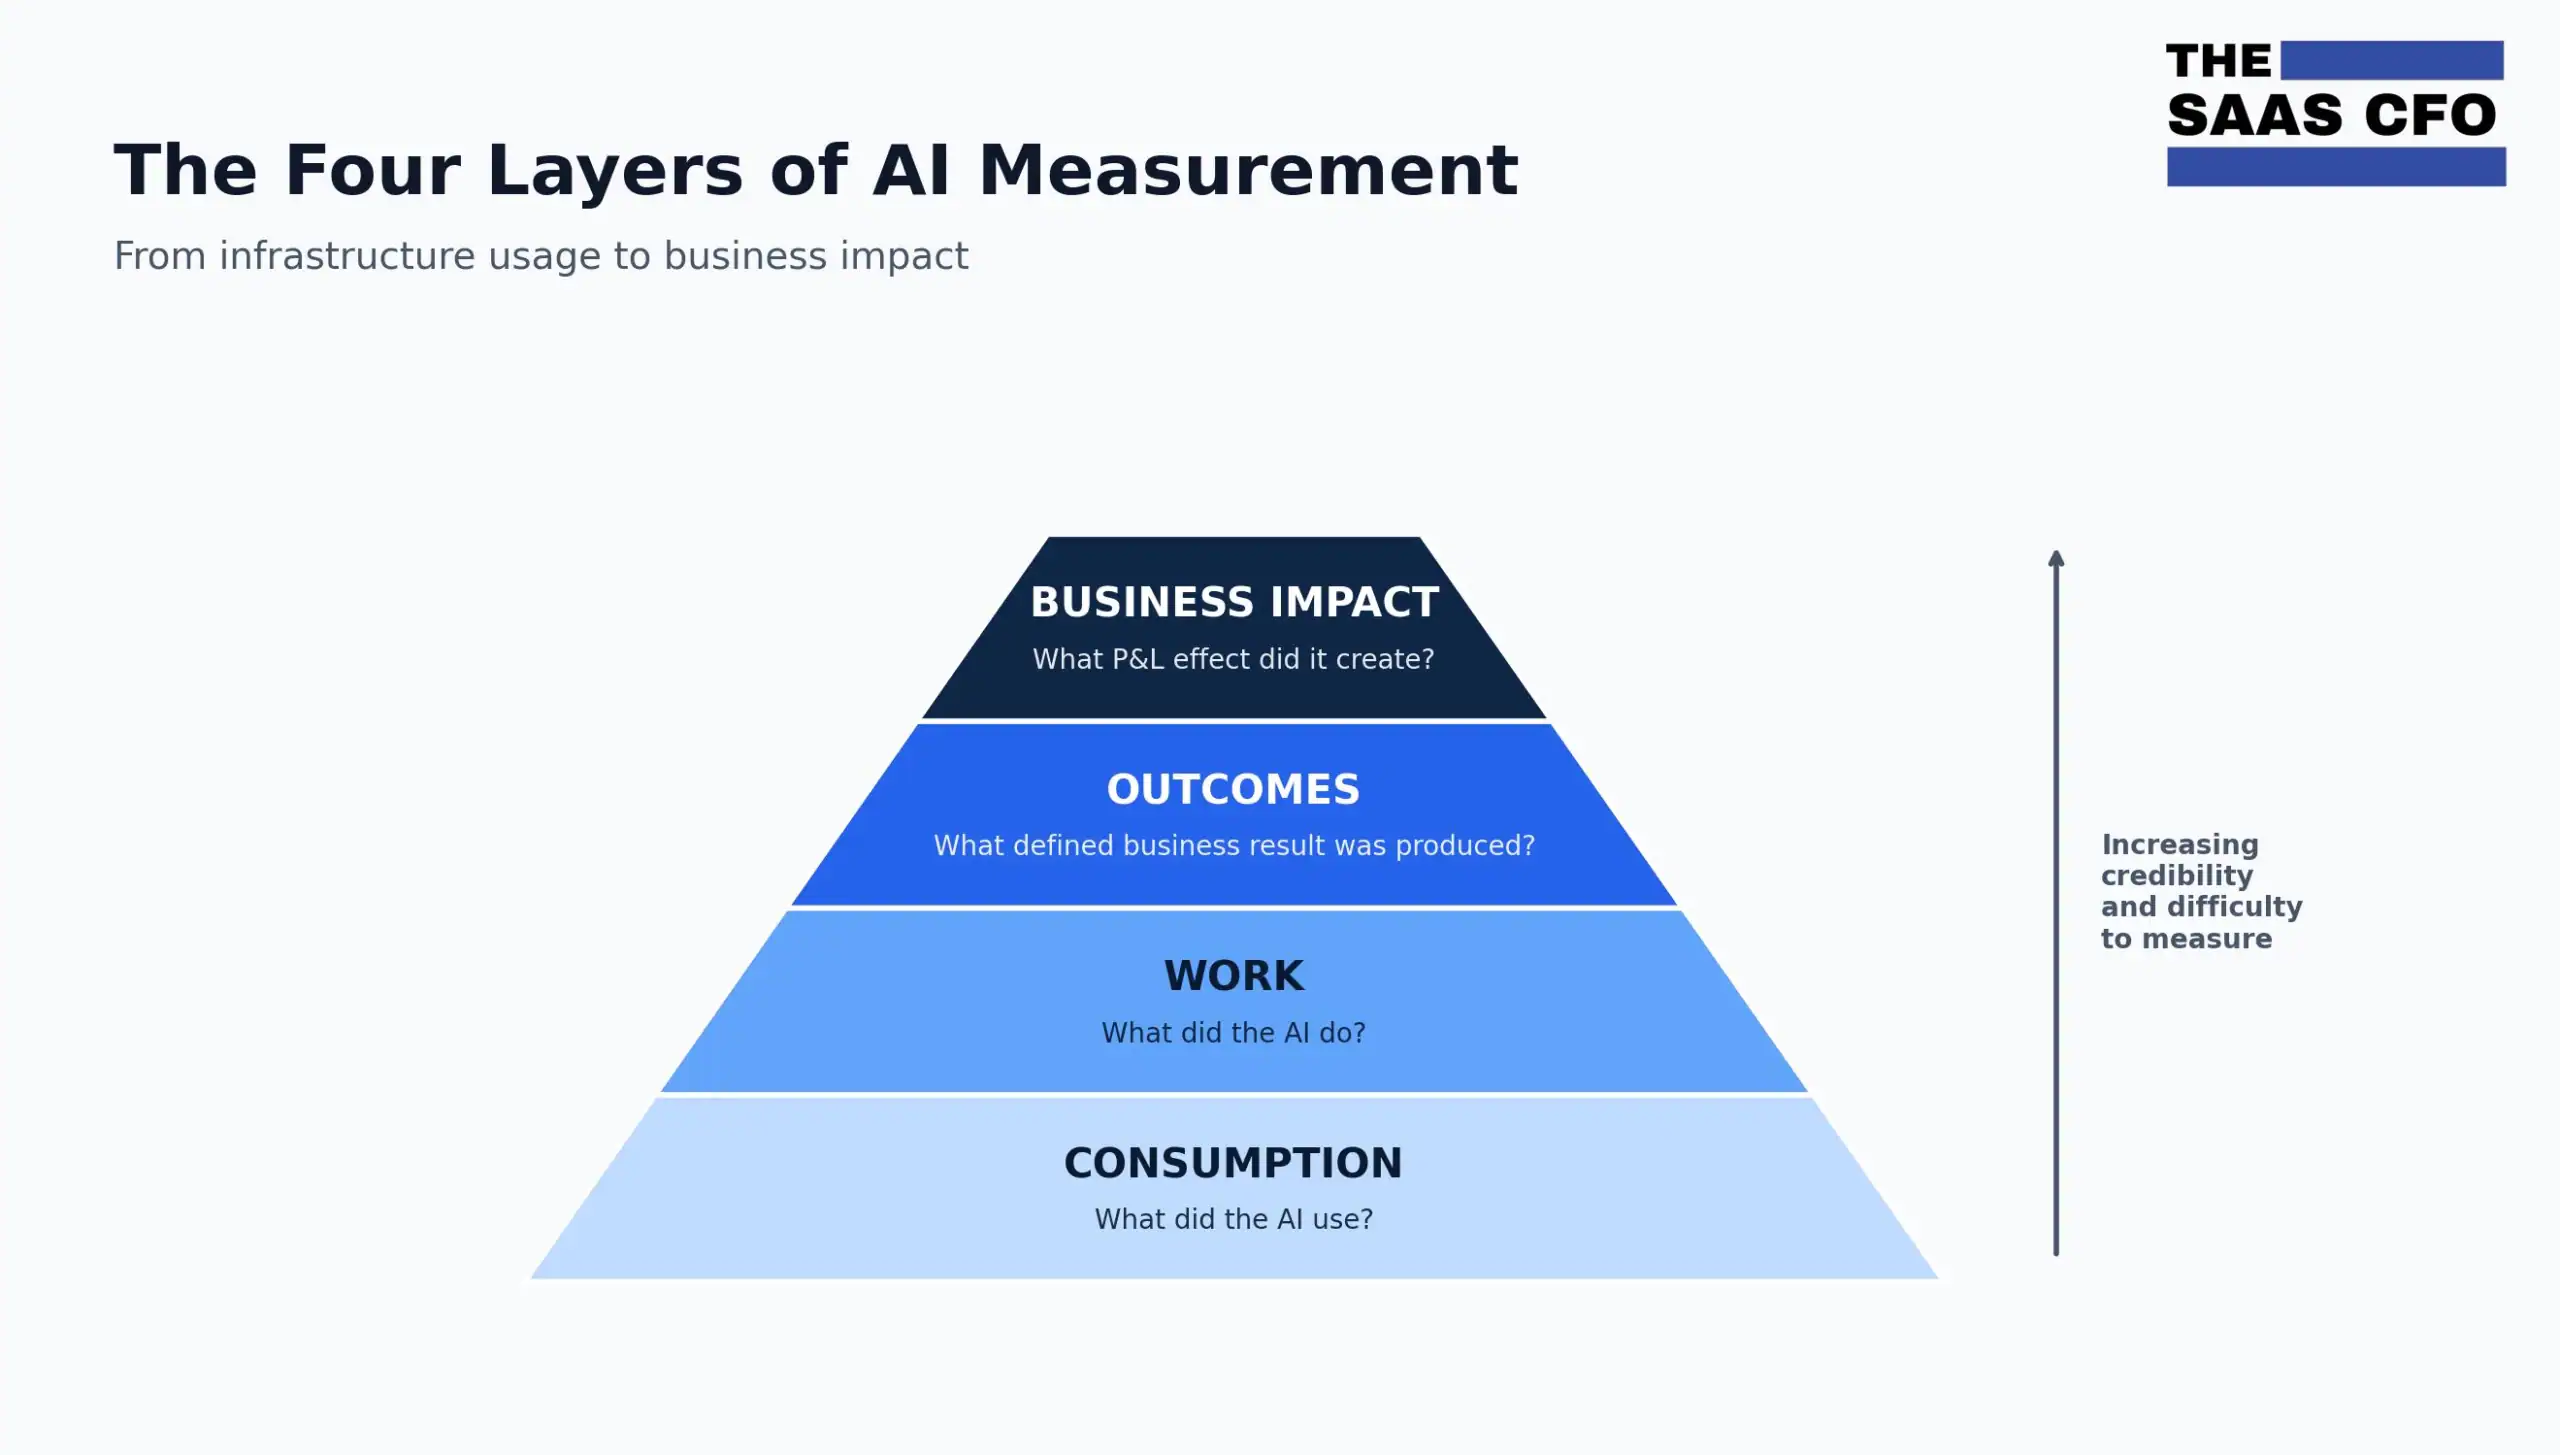
The progression matters. Each layer is harder to measure than the last. Each layer is more meaningful to customers, Boards, and investors than the previous layer. And each layer requires the layer below it to be true. You cannot claim Layer 4 hours saved without first being able to count Layer 3 resolutions. You cannot count resolutions without first having instrumented the AI’s work activity. You cannot instrument work activity without first having clean Layer 1 data.
Most companies are stuck at Layer 1. Better companies are building Layer 2. The leaders are at Layer 3. The very best are starting to credibly report Layer 4 with documented assumption methodology. And bringing those customers are on earnings calls!
You do not need to wait for a market standard. Pick the unit that fits your product. Reconciliation attempted (Layer 2). Ticket resolved (Layer 3). Hours saved per customer (Layer 4). The unit varies by product. The reporting logic is the same.
What Public Tech Companies are Proving
The major public software companies have started reporting better AI activity, and the patterns are useful even if we do not have a unified AI reporting framework. These patterns will emerge over time.
Salesforce Introduces the Agentic Work Unit (AWU)
On Salesforce’s latest earnings call, not only did they bring customers on the call to provide testimonials, but they introduced a new AI metric.
Salesforce introduced the Agentic Work Unit (AWU). One AWU equals one discrete task completed by an AI agent; a decision made, a record updated, a workflow triggered.
Marc Benioff described an AWU as “a record updated, workflow triggered, decision made, MCP called.”
Salesforce reported 2.4 billion AWUs delivered to date and more than 19 trillion tokens processed to date,[1] with 771 million AWUs in Q4 alone, up 57% QoQ.[2]
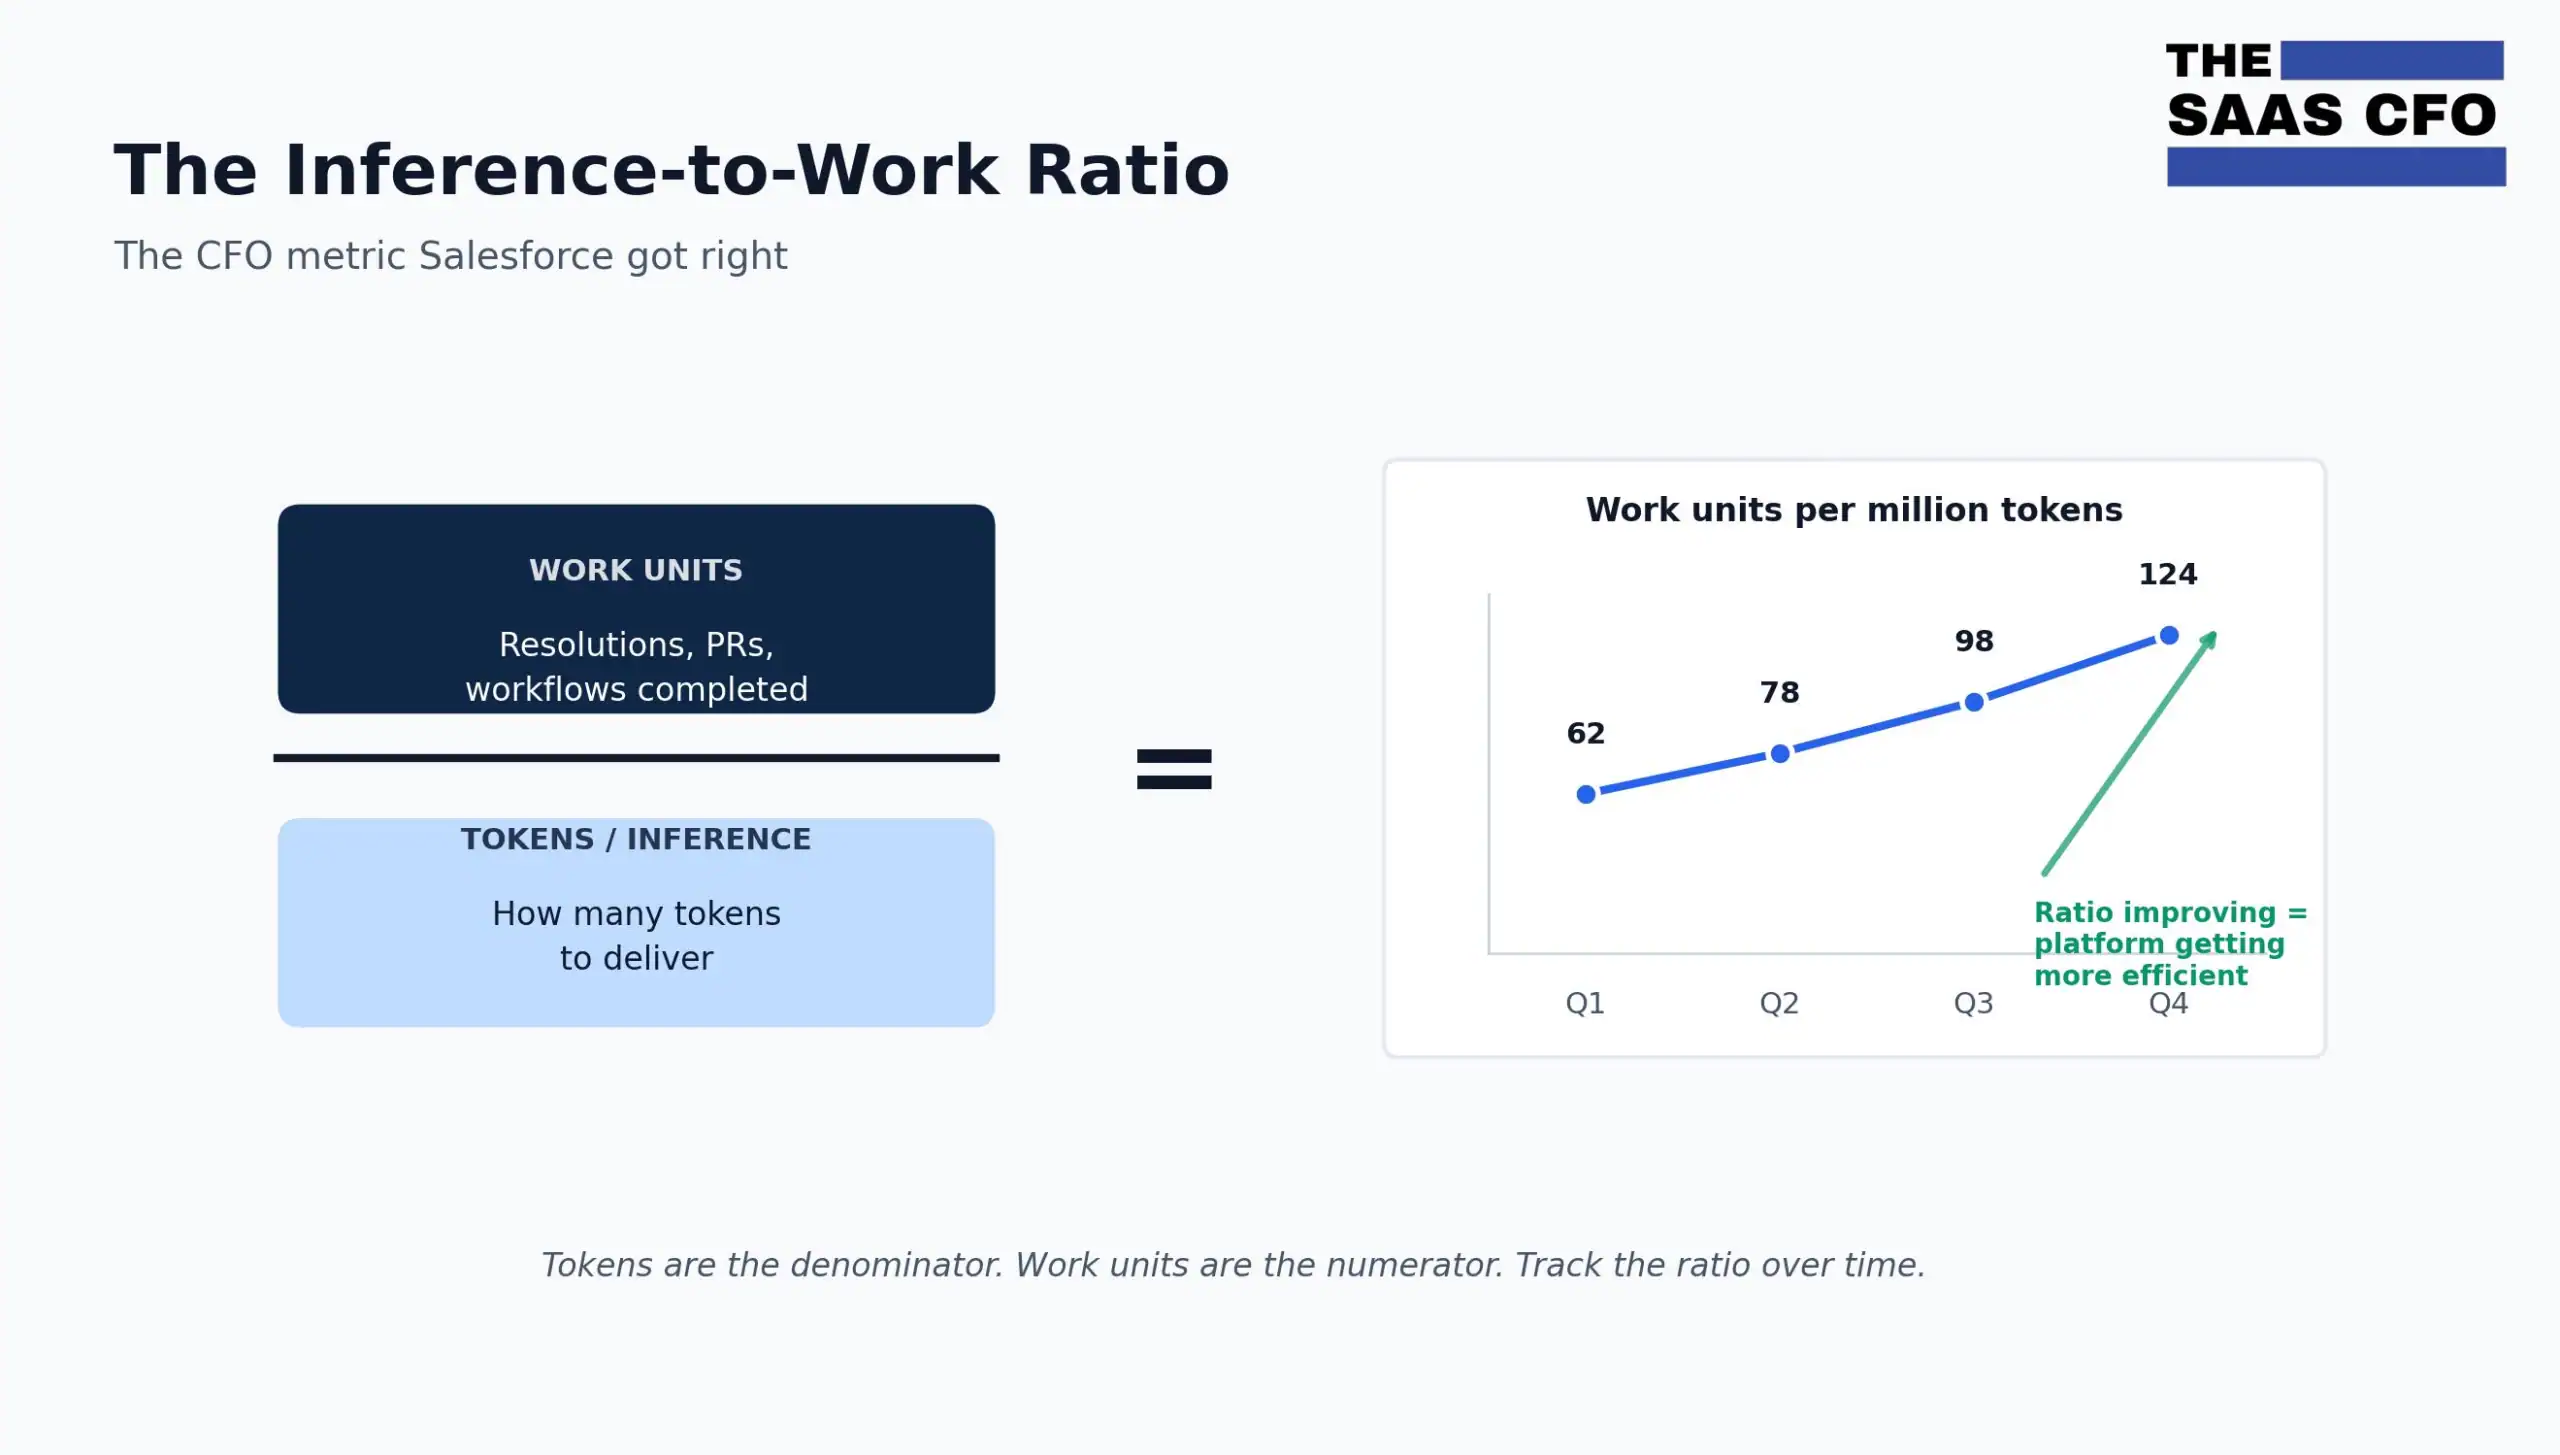
Taking AWU a step further, Salesforce mentioned the concept of the inference-to-work ratio. Agentic Work Units are in the numerator, and tokens are in the denominator [2]. The higher the ratio, the better for your customer. Let’s see if this metric takes off. I do like it.
The CFO takeaway: AWU is Layer 2 done well. It is a serious public attempt to define a unit of AI work, and the inference-to-work ratio is the kind of internal efficiency metric every AI vendor should track. But Layer 2 is not Layer 3.
The next question. Of 771 million AWU’s, how many produced a defined business outcome? I’m not sure if Salesforce has answered this, especially when you look at the Agentforce pricing card below.
ServiceNow: From Seats to Assist Packs
ServiceNow is doing two interesting things at once. On the pricing side, they are shifting from pure seats to a hybrid model where customers buy AI usage entitlements (called Assist Packs) on top of seat subscriptions. The more AI work the customer does, the more entitlements they consume. Now Assist surpassed $600 million in ACV, net new ACV more than doubled YoY, and deals over $1 million nearly tripled QoQ.[3] One fast-food customer expanded Assist Pack entitlements 13x at renewal based on expected usage.[3] That is Layer 1/2 territory; pricing follows consumption and work activity.
The more interesting claim is internal. ServiceNow’s own CFO, Gina Mastantuono, said ServiceNow was tracking toward roughly $100 million in internal headcount-related savings from deploying its AI products inside its own operations.[4] That is a Layer 4 claim (savings, not usage) and it is more credible than typical vendor savings claims because the vendor is reporting on itself, not on its customers. The vendor is eating its own dog food and putting a number on it.
The CFO takeaway: ServiceNow shows the layered architecture in practice. Charge for Layer 1/2 consumption (Assist Packs). Defend Layer 4 internally first before asking customers to defend their own Layer 4 numbers like Salesforce did on its earnings call. Most SaaS companies should follow the same sequence.
Intercom: Resolution as the Unit and the Price
Intercom is a customer support software company. Fin is its AI support agent. It handles customer questions through chat without a human involved. Fin is the cleanest public example of Layer 3 outcome-based pricing because Intercom defined exactly what counts as a billable “outcome” before they priced against it.
Intercom’s work unit is called an “outcome,” and it has two specific types. A Resolution counts when the customer either confirms Fin’s answer was satisfactory or exits the conversation without requesting further help after Fin’s last answer (an “assumed resolution” triggers automatically after 24 hours of no response).[5] A Procedure handoff counts when Fin executes a workflow the company explicitly configured to end with a handoff to a human or another system.[10] Both invoice at $0.99 per conversation, layered on a $49/month per seat model that includes 50 resolutions before outcome overage charges kick in.[6][10]
What makes the definition credible, and what CFOs should study, is the integrity rules. Customers are billed at most once per conversation, no matter how many questions Fin answered or procedures it ran. If a customer comes back to the same conversation later, even in a future billing period, and asks for more help, the resolution is reversed and not charged.
This is the sequence every CFO should pay attention to. Definition first. Instrumentation second. Pricing third. They built the data model that tracks specific events, agreed on what does and does not count (and what gets reversed), and then exposed that unit to the customer in the pricing model.
If you cannot count it, you cannot price it. You know that customers will find loopholes or definitional inaccuracies at renewal time.
Zendesk: Automated Resolutions and the Verification Layer
Zendesk’s AI billing unit is the automated resolution: a customer issue resolved by an AI agent without human involvement. One qualifying conversation equals one resolution equals one billable unit. Same Layer 3 territory as Intercom Fin, with a different defense mechanism.[7]
The structure is plan-based with overage. Team plans include 5 automated resolutions per agent per month, Professional and Growth include 10, and Enterprise includes 15, capped at 10,000 per year per account.[7] Customers buy more in committed blocks of 100 at better per-unit pricing, or pay overage monthly. Same pattern as ServiceNow Assist Packs.
A conversation counts only after a period of customer inactivity AND the customer either confirmed the answer or did not come back. Escalations to humans, negative feedback, and test conversations are all excluded.[7]
The CFO takeaway: Zendesk and Intercom both bill per resolved conversation (Layer 3), but they defined the unit, set the exclusions, and tied it to a clear pricing structure before scaling the product. Two valid architectures for the same Layer 3 work unit. That is the order of operations every SaaS CFO should follow.
Microsoft: Stuck Below the Framework
Microsoft is a cautionary example. 15 million paid Microsoft 365 Copilot seats (up more than 160% YoY), DAUs up 10x YoY, and 4.7 million paid GitHub Copilot subscribers.[8] Big numbers. But these metrics sit below Layer 1 in the framework — they measure access (seats) and engagement (DAUs), not consumption, work, outcomes, or impact. A user can have 30 Copilot conversations and produce nothing.
The CFO takeaway: seats and DAUs are not enough. They tell you who has access and who showed up. They do not tell you what the AI consumed, what the AI did, or what business result was produced. “AI engagement is up” stops being a satisfying answer in 2026.
AI Example: AI Support Product Unit Economics
Let’s put numbers to the four-layer framework. The example below uses Layer 1 (inference cost) and Layer 3 (resolutions) to show why tracking only the layer below your billing unit will mislead you.
Imagine you are running an AI support product. You charge $0.99 per resolution, similar to the Fin pricing benchmark. A mid-sized customer drives 50,000 conversations per month. That is your AI attempts volume; the number of customer issues your AI tries to handle. Whether each conversation converts to a billable Layer 3 resolution depends on what happens inside the conversation.
Now the cost side. Each conversation consumes tokens. A reasonable assumption: 6,000 input tokens (customer message, retrieved knowledge base articles, conversation context) and 2,000 output tokens (the AI response).
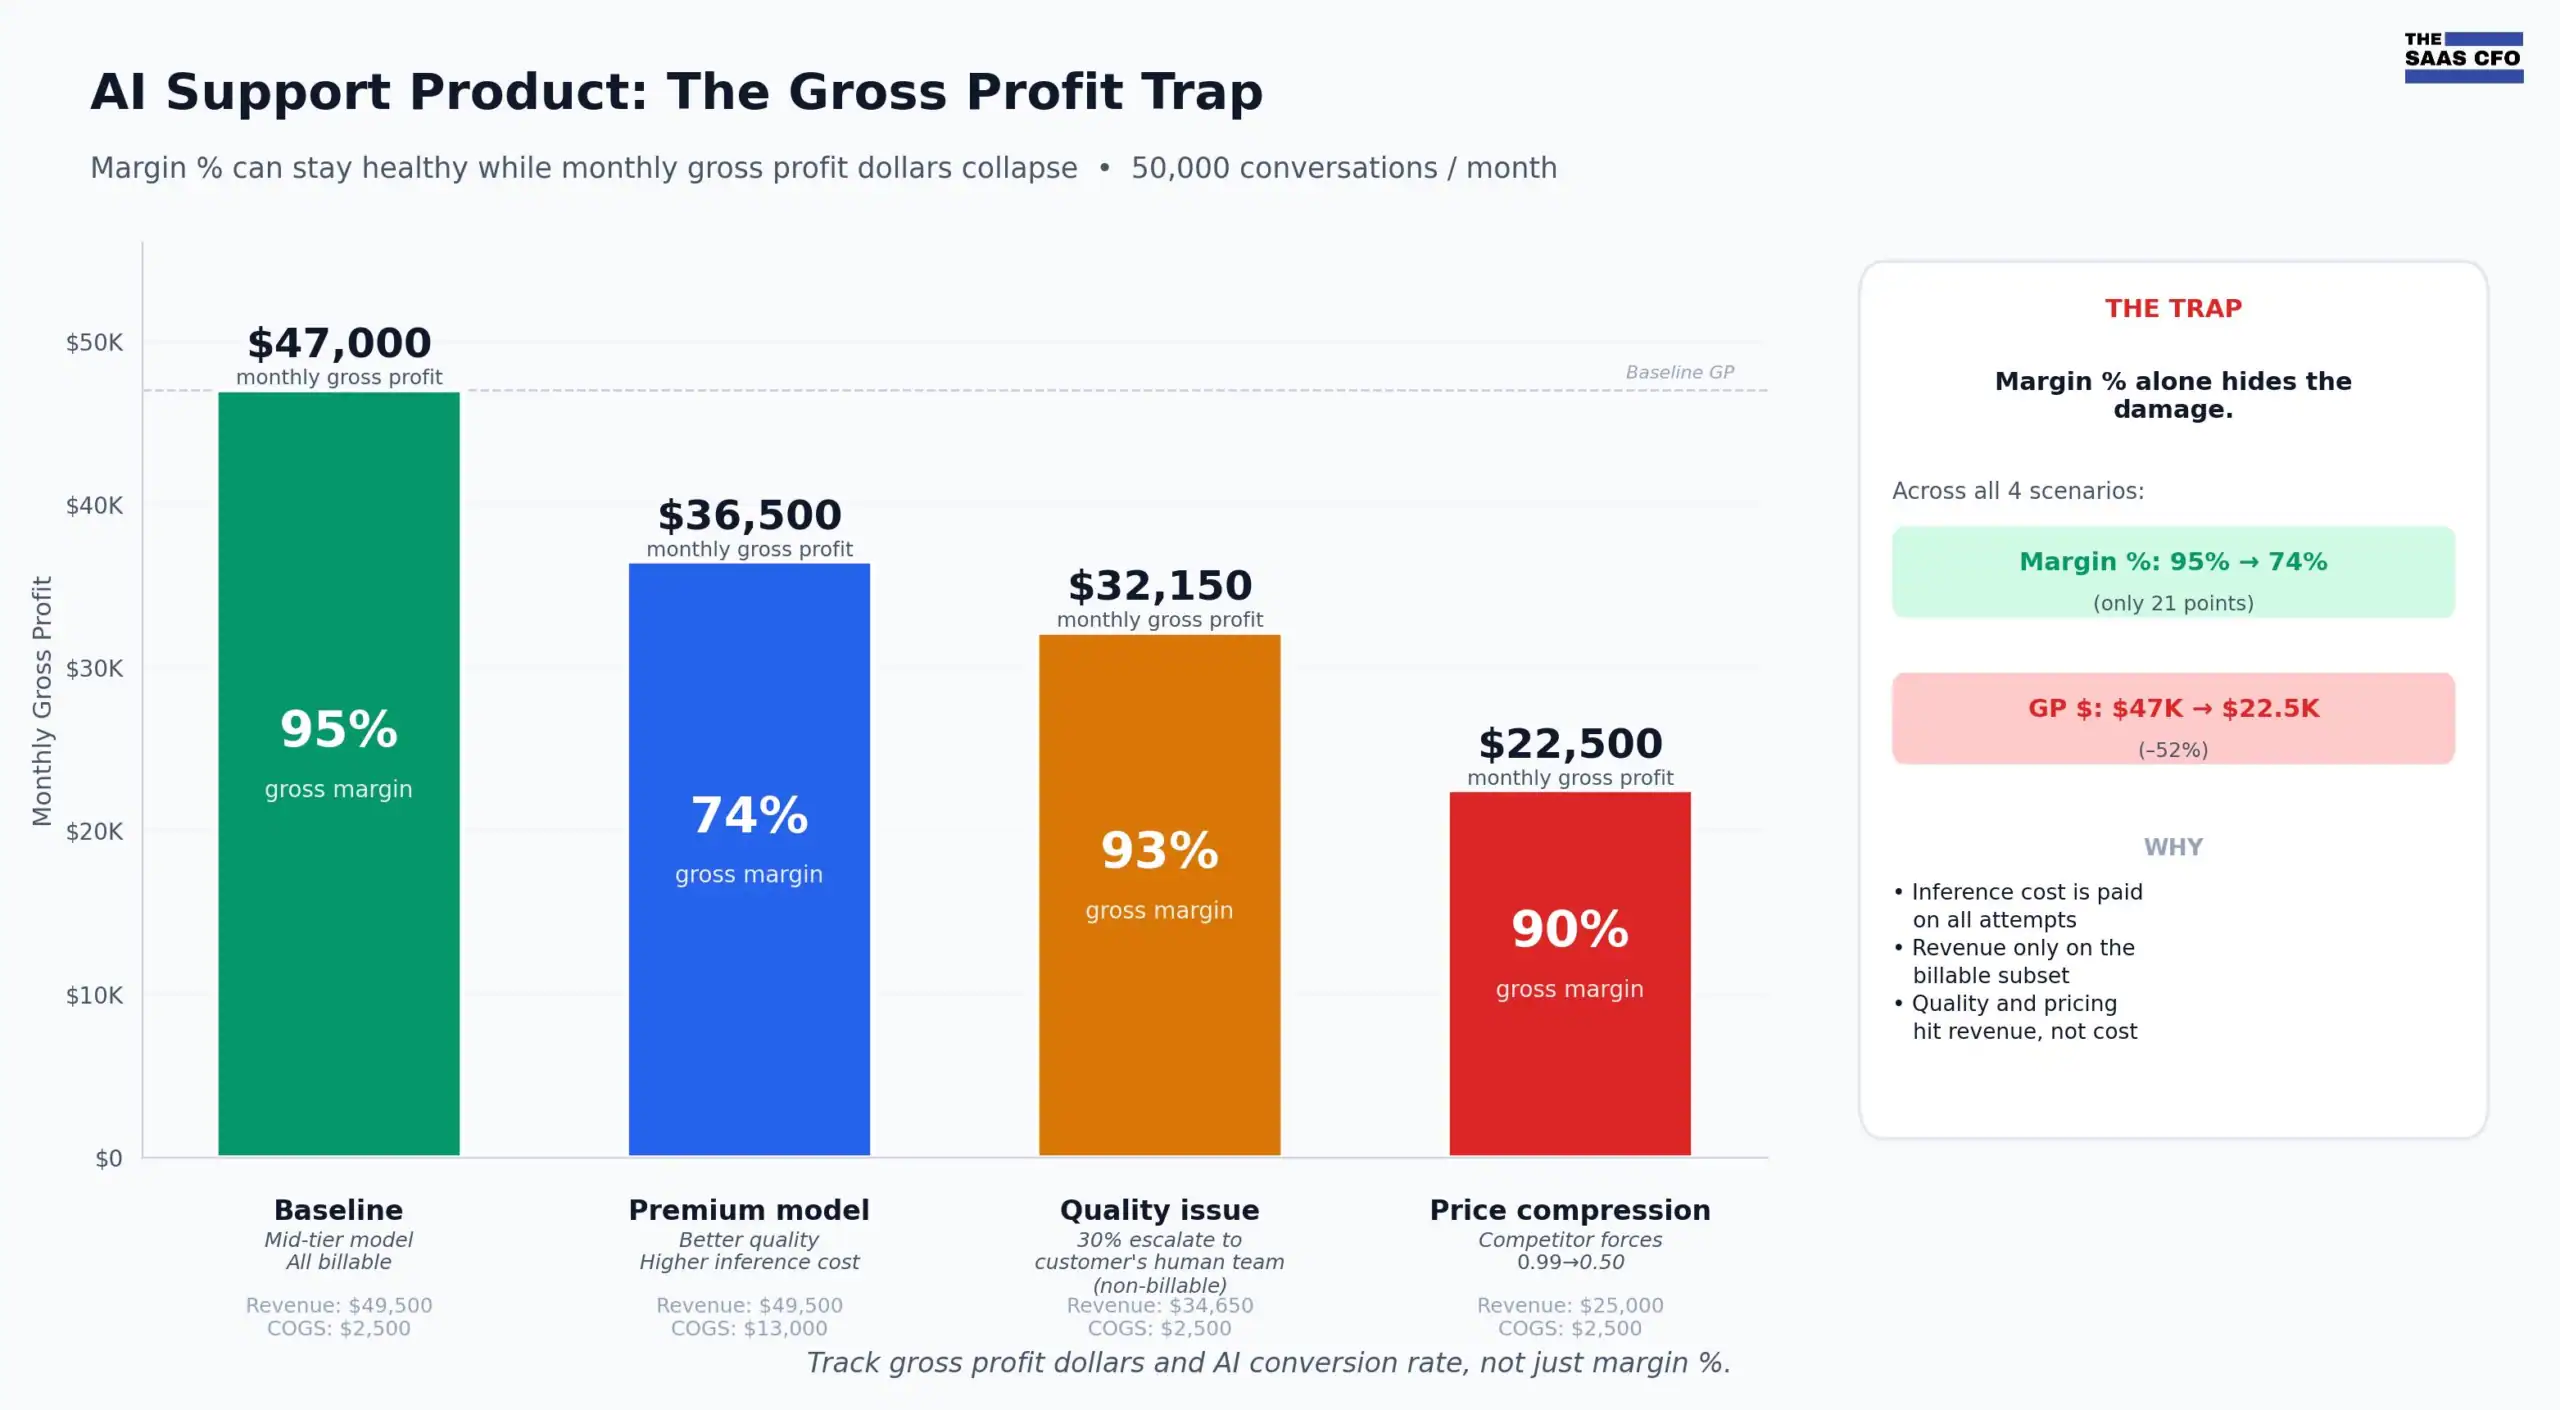
Scenario 1: Baseline (Layer 1 cost ÷ Layer 3 outcomes, healthy ratio)
Mid-tier model at $2 per million input tokens and $10 per million output tokens. Let’s assume 100% of conversations convert to billable resolutions.
- Input cost: 6,000 × $0.000002 = $0.012
- Output cost: 2,000 × $0.00001 = $0.020
- Inference cost per conversation: $0.032
- Plus, orchestration, retrieval, and observability overhead at $0.02
- All-in cost per conversation: $0.05
- Revenue: 50,000 × $0.99 = $49,500
- Cost: 50,000 × $0.05 = $2,500
- Gross profit: $47,000, or 95% margin
Healthy SaaS margin profile. This is what the dashboard looks like when everything is working.
Scenario 2: Premium model (Layer 1 cost rises, Layer 3 outcomes flat)
Same product, but on a premium model at $15 per million input tokens and $75 per million output tokens. Still 100% conversion to billable resolutions. We can’t assume that all we need are cheap models.
- Inference cost: 6,000 × $0.000015 + 2,000 × $0.000075 = $0.24
- Plus overhead: $0.26 per conversation
- Revenue: 50,000 × $0.99 = $49,500
- Cost: 50,000 × $0.26 = $13,000
- Gross profit: $36,500, or 74% margin
Still solid, but gross margin just dropped 21 points based purely on model choice. That is a Layer 1 finance decision and product decision. The margin loss is visible in the dashboard.
Scenario 3: Quality issue (Layer 1 cost flat, Layer 3 outcome conversion drops)
Back to the mid-tier model. But now 30% of conversations escalate to the customer’s human support team because the AI got it wrong or the customer pushed back. Under the Intercom and Zendesk models, escalated conversations are not counted as resolutions and you do not bill them.
- AI conversion rate: 70% (35,000 of 50,000 conversations bill)
- Inference cost is incurred on all 50,000 conversations regardless: 50,000 × $0.05 = $2,500
- Revenue: 35,000 × $0.99 = $34,650
- Gross profit: $34,650 − $2,500 = $32,150, or 93% margin
The gross margin percentage actually holds up at 93%. But total gross profit dollars dropped from $47,000 to $32,150 — a 32% drop in gross profit on the same inference spend. You are paying for inference on conversations whether billable or not.
This is the quality trap, and it is invisible in a Layer 1 dashboard. You only see it if you track three things side by side: AI attempts (Layer 1 footprint), billable outcomes (Layer 3), and the conversion rate between them.
Scenario 4: Price compression (Layer 1 cost flat, Layer 3 revenue per outcome drops)
Mid-tier model, 100% conversion, but a competitor pressures you down to $0.50 per resolution.
- Revenue: 50,000 × $0.50 = $25,000
- Cost: 50,000 × $0.05 = $2,500
- Gross profit: $22,500, or 90% margin
Margin still looks great at 90%, but gross profit dropped from $47,000 to $22,500. More than 50% of your gross profit was destroyed by Layer 3 pricing pressure. Again, the dashboard looks healthy until you check the dollars.
The same $0.99 product can be a 95% gross margin business with $47,000 of monthly gross profit, or a 90%+ margin business with less than half that. The three variables that determine which one you are — outcome conversion, outcome pricing, and outcome quality which all sit at Layer 3. None of them show up if you only watch Layer 1.
This is why the CFO must be in the AI metrics conversation. The same product can be very different businesses depending on what’s happening at a layer the engineering and infrastructure dashboards never reach.
Sample CFO AI Metrics Dashboard
Here is what a monthly AI metrics page might look like for a hypothetical $5M ARR AI support company.

A few notes on why this dashboard is intriguing.
The top three rows give you an income statement view of AI. Revenue, COGS, gross margin. That is the language your Board already speaks.
The middle rows connect activity to economics. Cost per resolution and resolutions per million tokens are the unit economics. They will move based on model choice, prompt efficiency, and caching strategy.
The quality rows are non-negotiable. Resolution rate without repeat contact rate is a misleading number. Resolution rate without CSAT is a vanity metric. If resolution rate is up but repeat contacts are up, you are not improving the business.
The bottom rows translate work into customer outcomes. Hours saved and cost avoided are estimates, but they are the language of customer ROI and renewal conversations. NRR will be interesting, but I think increasing AI ARPA over time might be more interesting.
This is not an exhaustive dashboard. But it is enough for a B=board meeting, and it is more useful than a token chart.
The AI Work Unit Definition Template
Defining your work unit is the single highest-leverage action in this whole framework. Get this right and the rest of the dashboard falls into place. Get it wrong and you will be rebuilding the metric in six months when product ships a feature change and nobody can agree on whether it still counts.
This is what a clean work unit definition looks like. Three filled examples first, then a blank row to fill in for your own product.
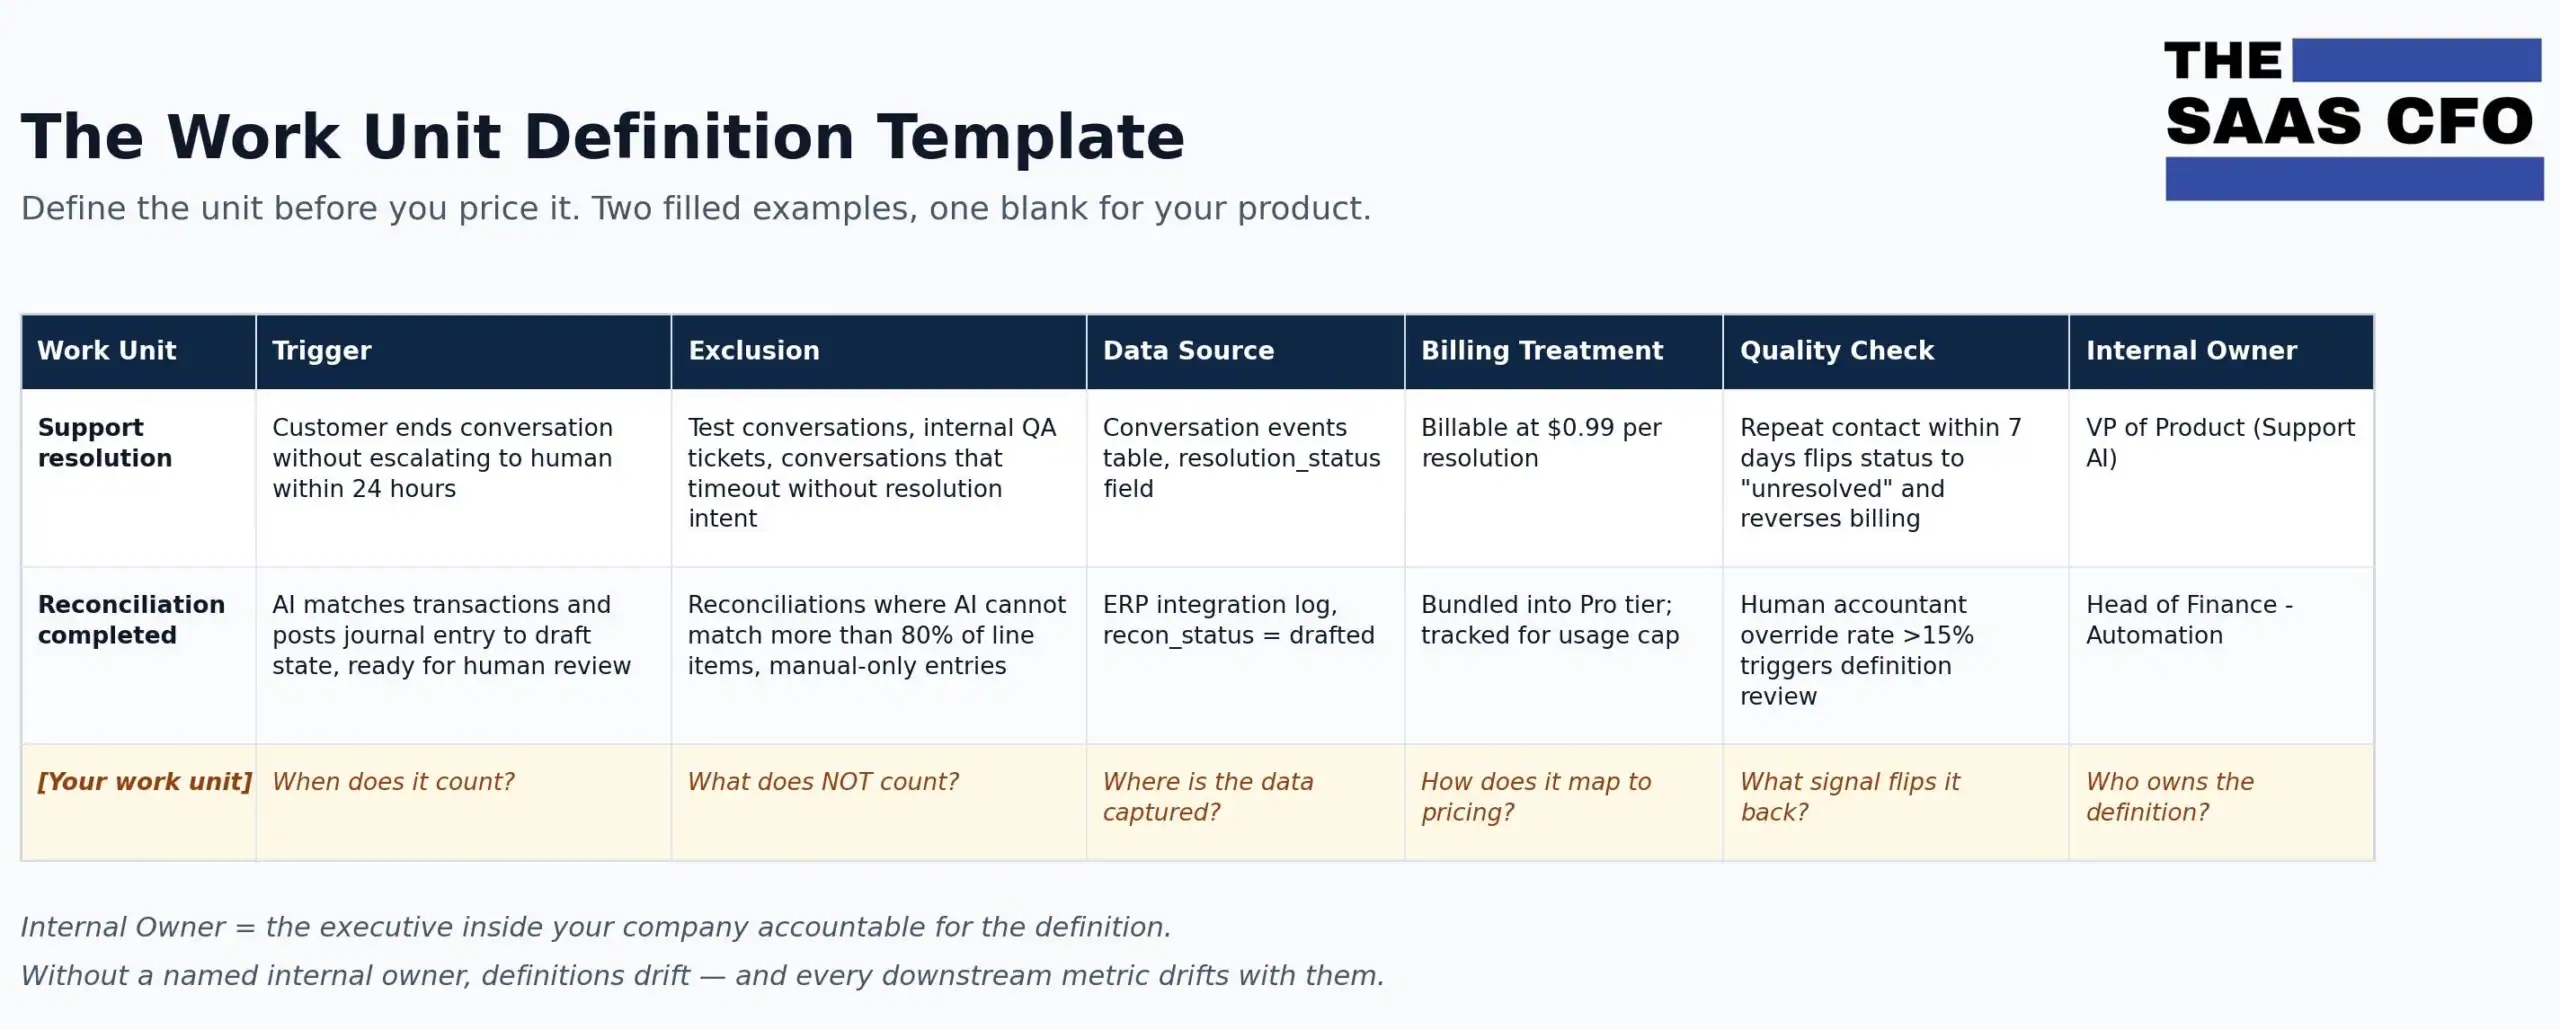
A few things to notice about how the examples work.
The Trigger column is the most important. It must be specific enough that two engineers from different teams would count the same number. “Resolution” is too vague. “Customer ends conversation without escalating to human within 24 hours” is countable.
The Exclusion column is where most metrics break. Without it, test data, internal traffic, and edge cases inflate the numbers and the metric loses credibility the first time someone audits it.
The Quality Check column is what makes this an honest metric instead of a vanity number. Notice that the support resolution example reverses billing if the customer comes back within 7 days. That is not a small detail. It is what separates a measurement system from a marketing claim.
The Owner column is what keeps the definition stable over time. Someone must be accountable for the metric definition itself, not just the metric value. When product ships a change that affects how a unit is counted, the owner is the person who updates the definition and communicates the change to finance and the board. Time to bring back that pricing committee! Please make sure your CFO is involved.
The AI CFO Framework: What to Build, In Order
Six steps. They are not equally urgent. If you only have a few weeks, focus on the first three.
1. Identify where AI costs sit on the P&L. Are token API costs buried in hosting? Are model vendor invoices in software subscriptions? Is internal AI tooling in G&A while customer-facing AI inference sits in COGS? This must be clean and well-structured in your chart of accounts. See my AI margins post for more details. Eventually, you need monthly AI cost by vendor, by product, by feature, and by customer segment if material.
2. Define one work unit. Use the template above. Pick the unit that is most central to your product’s value proposition and most countable in your data. Resolved ticket. Reconciliation completed. Qualified meeting booked. The unit should be simple, countable, and meaningful to the buyer. If your customer would not understand or care about it, it is not the right unit.
3. Build the dashboard for that one unit. Revenue tied to it, COGS tied to it, gross margin, volume, cost per unit, quality metrics. Get one dashboard right before you build five. Put it in the monthly reporting package and review it.
The next three steps are important but follow naturally once the first three are working.
4. Connect work units to cost. Cost per resolution. Cost per workflow. Tokens per work unit. This is your unit economics view of AI. It informs pricing, packaging, and customer profitability analysis. This is where things might get hard. I think our internal tooling will have to catch up here. The controller’s standard chart of accounts will not cut it.
5. Connect work units to outcomes. You will not be perfect at first. Document your assumptions, get cross-functional buy-in, and improve quarterly.
6. Build the data table behind the metric. Event-level detail per work unit: customer, product, feature, workflow, completion flag, human review flag, token cost, downstream outcome. This is the boring data foundation that makes the dashboard credible.
Why AI Measurement Drives Pricing
This is not just a reporting issue. The pricing model follows the measurement model.
If you only measure users, you will default to user pricing. If you measure work, you can price work. If you measure outcomes, you can price outcomes. You cannot charge per resolution if you cannot define a resolution. You cannot sell shared savings if you cannot prove savings. You cannot price AI labor replacement if you cannot count the labor equivalent. This is Layer 4 level.
Look at how this is already playing out:
- Intercom prices Fin per resolution because resolution is instrumented. Outcome-based pricing.
- ServiceNow sells Assist Pack consumption because AI work is tied to workflow usage. Hybrid seat-plus-consumption.
- Salesforce built AWU as a defined unit of agentic work, which gives them a measurement foundation for usage and outcome pricing over time.
GitHub is now moving to a usage model. The seat model is under pressure because seats assume humans are the unit of work. If AI agents do the work, the number of humans does not scale with value created. That breaks the old pricing logic; hence, the SaaS is dead mantra.
A practical implication for founders. If your roadmap includes AI agents that do work humans used to do, your pricing model is on a clock. Per-seat pricing assumes humans equal value, and the moment AI breaks that assumption your largest customers will notice. Vendors with measurement infrastructure already in place get to set the new pricing model on offense. Vendors without it get cornered into renegotiating while the customer is already skeptical and the value capture has already shifted.
Three Things to Do This Week
If you only do three things from this post, do these.
One: pull a clean AI cost report for the last three months. Not a guess. An actual report from your accounting system or a manual roll-up from you AI vendors. Vendor by vendor, product by product. Most finance teams cannot produce this on demand right now, and that is the first problem to solve. You cannot manage what you cannot see. See this post for more info: https://www.thesaascfo.com/a-cfos-guide-to-tracking-digital-labor-and-agentic-ai/
Two: fill in the work unit template. One unit. One paragraph per column. Get product, finance, and customer success to agree on it in writing. The template above has the structure. Sign off in writing.
Three: build a one-page AI metrics summary for your next leadership or board meeting. Even if the data is incomplete. Can you show AI revenue, AI COGS, AI gross margin, work units completed, and cost per unit? The first version might be embarrassing. The act of producing the report will surface every gap you need to close in the next quarter.
These three steps will not get you to a perfect AI reporting framework. They will get you out of token-only reporting, which is the single biggest reporting gap in SaaS today.
Five AI Finance Traps to Avoid
Confusing layers in your reporting. Tokens are not work. Work is not an outcome. Outcomes are not business impact yet. Each layer answers a different question and treating one as the other is how AI reporting becomes ambiguous.
Ignoring quality. AI can create more volume and a worse customer experience at the same time. Resolution rate up, CSAT down, repeat contacts up. That is not improvement. That is moving the problem around.
Forgetting gross margin. AI features can be expensive. If you price on outcomes but do not understand inference cost, you will create a margin problem. Measure both sides.
Overcomplicating the metric. ARR worked because everyone understood it; well, almost all. NRR worked because it told a clear story. Your AI work metric needs the same clarity. If you have to explain it three times, it is the wrong metric.
Not reconciling AI activity to billing. If you charge by work unit or outcome, finance needs confidence that billable events are complete and accurate. This is a quote-to-cash problem, not a product analytics problem. Auditors will eventually ask.
Where This Is Headed
The SaaS industry standardized around ARR, NRR, CAC Payback, gross margin, and Rule of 40 because those metrics helped operators and investors understand the business. AI needs the same evolution.
Right now, every company is inventing its own metric. Salesforce has AWUs. Intercom has resolutions. Zendesk has end-to-end resolved interactions. ServiceNow has AI workflow consumption. Coding tools have accepted code and merged PRs. There is no universal standard yet.
Within 18 months, the SaaS companies that cannot report AI work units alongside ARR and gross margin will struggle in three places.
- They will struggle in renewals because customers will demand ROI proof.
- They will struggle in pricing because they will be stuck on the seat model while competitors move to outcomes.
- They will struggle in diligence because investors will start asking for AI gross margin and AI work output the same way they ask for NRR and customer cubes today.
The companies that move first will set the vocabulary. AWU may not win, but it’s a very clear metric. Resolution may not be the universal unit. But some version of work-and-outcome reporting will become the standard. The software CFOs who build the data foundation now will write the playbook for everyone else.
The AI is doing the work. Now, as a CFO, it’s our job to count and measure it correctly.
Sources and Footnotes
[1] Salesforce Q4 FY26 earnings release. Supports 2.4 billion AWUs delivered to date, more than 19 trillion tokens processed to date, and Q4 disclosures.
[2] Salesforce Agentic Work Unit explainer and Salesforce News article, “The Agentic Work Unit: Converting Raw Intelligence into Real Work.” Supports 771 million Q4 AWUs, 57% QoQ growth, and the inference-to-work framing.
[3] ServiceNow Q4 2025 earnings release and earnings call transcript. Supports Now Assist surpassing $600M ACV, Now Assist net new ACV more than doubling YoY, deals over $1M nearly tripling QoQ, and the 13x Assist Pack entitlement expansion at renewal.
[4] The Register coverage of ServiceNow’s Q2 2025 earnings call. Supports the roughly $100M AI-powered headcount savings claim attributed to CFO Gina Mastantuono. Use the original Q2 2025 transcript as primary source where available.
[5] Intercom Help Center, “Fin AI Agent outcomes.” Supports how Fin defines a resolution or outcome, including confirmed and assumed resolutions.
[6] Fin AI and Intercom pricing and benchmark pages. Supports $0.99 per outcome/resolution pricing, 67% average resolution rate across 7,000-plus customers, and 40 million-plus conversations resolved.
[7] Zendesk Support documentation, “About automated resolutions for AI agents,” updated February 25, 2026. Supports the automated resolution definition, channel-specific trigger logic, 72-hour inactivity rule, exclusion criteria, plan allocations (5/10/15 resolutions per agent per month), the 10,000 annual cap, and the committed-usage versus overage billing structure.
[8] Microsoft FY26 Q2 earnings call transcript. Supports 15M paid Microsoft 365 Copilot seats, more than 160% YoY seat growth, DAUs up 10x YoY, and 4.7M paid GitHub Copilot subscribers.
[10] Fin pricing: Outcomes https://fin.ai/help/en/articles/13975800-fin-pricing-outcomes?gtm_id=7a895b41-1b62-4931-acc1-c6321d987a6f
I have worked in finance and accounting for 25+ years. I’ve been a SaaS CFO for 9+ years and began my career in the FP&A function. I hold an active Tennessee CPA license and earned my undergraduate degree from the University of Colorado at Boulder and MBA from the University of Iowa. I offer coaching, fractional CFO services, and SaaS finance courses.
Great post! Cutting-edge technology is changing the world of accounting by the second! Thank you for sharing!
Thanks! Things are moving fast. Our chart of accounts will evolve with AI pricing.
This is one of the clearest breakdowns of AI measurement I’ve seen. I’ve been writing about this and other challenges from the workforce side in my AI Users to AI Managers series since the start of 2026.
The progression from consumption to work to outcomes to business impact is exactly the discipline most organizations are missing right now.
A few things I’d add from the workforce side. Layer 3 outcomes and Layer 4 business impact are only as honest as the supervisory behavior beneath them. Two employees can produce identical outcome counts on the dashboard while one is genuinely managing the AI (checking sources, escalating when warranted, taking ownership of the decision) and the other is just passing through whatever the system produced. The financial framework can’t tell them apart, but the risk profile is dramatically different, and one bad incident is usually what makes that gap visible.
This framework counts work units as flat numbers, but an organization can have strong AWU or resolution counts that come almost entirely from low-stakes workflows employees feel safe using AI for, while the consequential work continues to be handled the old way. The dashboard looks healthy, the financial story holds, and the actual value case is quietly absorbed by drafting and exploratory tasks. A useful addition would be measuring what percentage of AI activity is happening in workflows that carry real consequence, because that’s the only number that distinguishes adoption from usage.
The other piece worth flagging is that quality metrics in your framework are downstream confirmations like CSAT and repeat contact rate. Verification behavior is upstream and harder to instrument, but it’s the leading indicator of whether the program is building real capability or producing automated risk that hasn’t hit the dashboard yet. An organization with high outcome volume and low verification behavior is exactly the kind of place that ends up in a Forrester-style reversal, where AI-attributed work gets pulled back at higher cost than the headcount it replaced.
Your framework and the behavioral measurement layer need each other. The numbers you describe are what get AI taken seriously in the rooms where investment decisions get made, and the behavioral signals are what keep those numbers from quietly disconnecting from reality over time.
The biggest challenge is getting organizations to realize that this isn’t something they have done before and the initial rollout of this type of measurement is going to take effort. AI isn’t magic and neither is measuring its effect on the business.
Ben, I wanted to let you know that I expanded on the comment I left on your four-layer framework piece into a full article. I’ve been writing about AI adoption challenges from the workforce side in my AI Users to AI Managers series, and your framework gave me a natural entry point to connect the financial measurement conversation to the behavioral one.
The article is titled “From AI Users to AI Managers: Extending the CFO AI Measurement Framework” and I’ve shared it on LinkedIn and Substack. I think the two perspectives complement each other well, and I hope you find it a useful addition to the conversation you started.
https://www.linkedin.com/pulse/from-ai-users-managers-extending-cfo-measurement-brian-kuchta-pmp-1vhte