A New Metric in an IPO Filing
Anthropic’s S-1 includes a chart I didn’t expect to see in an IPO filing. It’s titled “Significant increase in revenue per dollar of compute.” I had a big smile on my face.
The math is simple. Divide each quarter’s revenue by that quarter’s compute and infrastructure expense. Anthropic’s ratio went from 0.40x in Q1 2025 to 2.08x in Q2 2026. The company calls that a 5.2x improvement in compute efficiency.
Beside loving this metric, I had three questions. What exactly is Anthropic measuring? Does anyone else report it? And can we use the S-1 data to back into Anthropic’s Inference Efficiency Ratio (IER) I introduced as part of the AI Economics pillar? Here’s what I found.
What Anthropic Reports
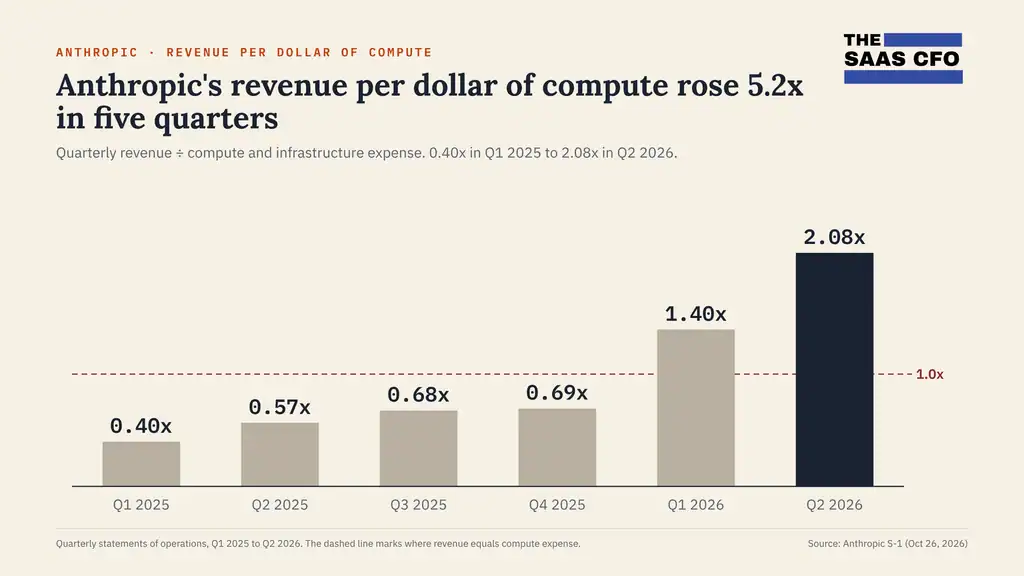
The numerator is revenue. The denominator is the whole “Compute and infrastructure” line on the income statement. That covers research, model training, serving customers, free users, and internal use of Claude, plus data center leases, power, and depreciation.
The ratio answers a big question: is the whole compute bill paying for itself? It finally crossed 1.0x in Q1 2026.
Why was it below 1.0x through 2025? Two reasons. First, the denominator includes all compute, including training the next model. Second, Anthropic locks in compute 12 to 18 months before it arrives. It doesn’t book an expense when it signs. It books the expense when the capacity comes online. But from that day on, it’s a fixed cost. So expenses jump first, and revenue grows into the new capacity over the following quarters.
The S-1 shows the catch-up: Q2 2026 revenue grew 1,368% year over year while compute grew 300%.
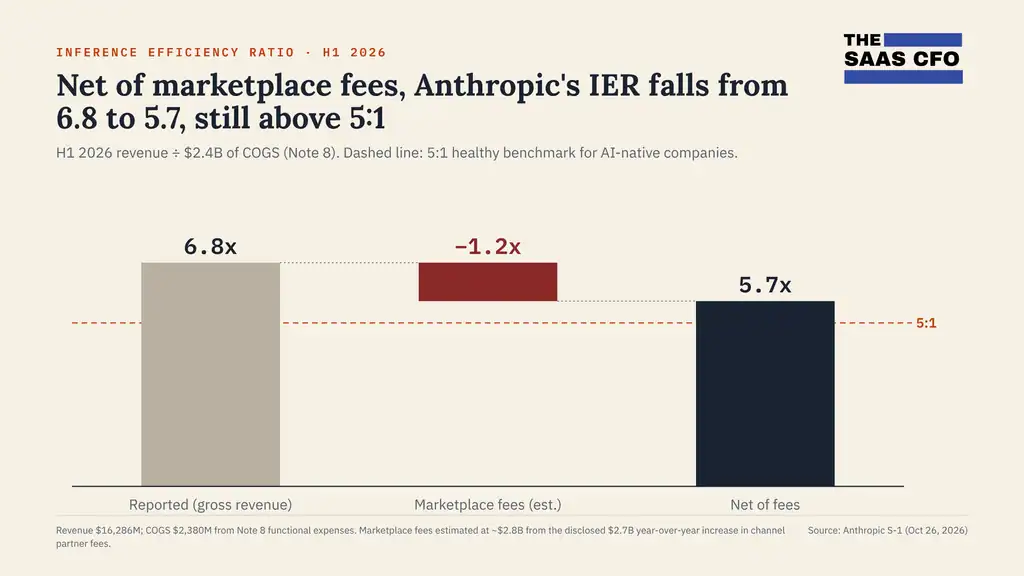
That ratio uses gross revenue, including the full price of sales through cloud marketplaces. Here’s the bridge to net revenue for H1 2026, the half-year view of the same metric.
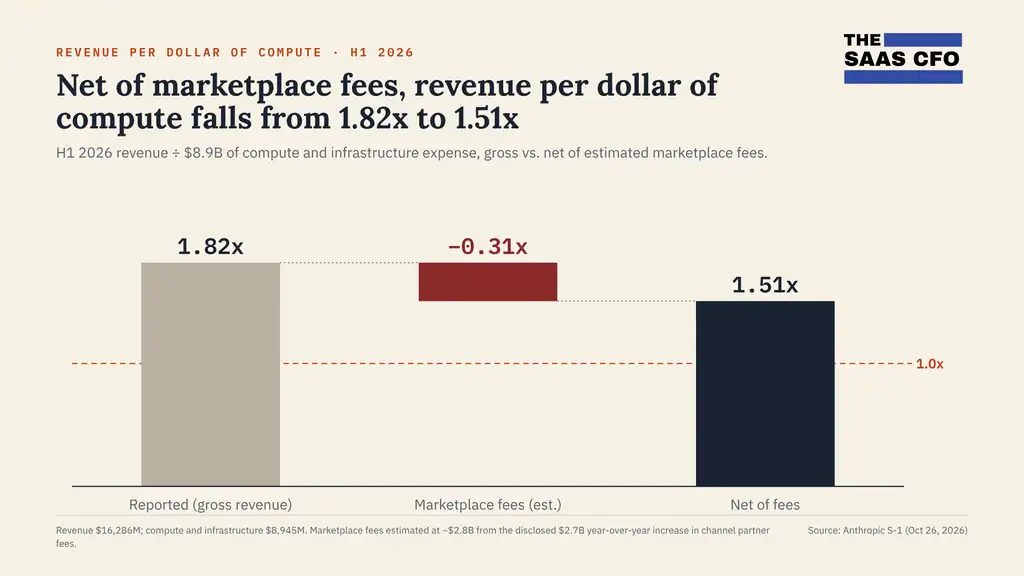
Anthropic S-1: H1 2026 revenue and compute expense. Marketplace fees estimated at $2.8B from the disclosed $2.7B year-over-year increase in channel partner fees.
Net of fees, Anthropic still earns about $1.50 for every dollar of compute.
Does Anyone Else Report It?
Not in a public mentions that I could find. Anthropic looks like the first. But there are close cousins.
- OpenAI: revenue per gigawatt. In January 2026, CFO Sarah Friar published compute next to revenue: 0.2 GW and $2B ARR in 2023, 0.6 GW and $6B in 2024, and about 1.9 GW and $20B+ in 2025. That’s about $10 billion of ARR per gigawatt every year. She wrote that revenue “directly tracks available compute.” It’s measured in power, not dollars, and uses ARR, not GAAP revenue.
- OpenAI: compute margin. The Information reported that OpenAI’s “compute margin,” the share of revenue left after the cost of running models for paying users, hit 70% in October 2025. That’s up from 52% at the end of 2024. OpenAI didn’t confirm it. This is the closest cousin to IER. A 70% compute margin equals an IER of about 3.3 to 1.
- Microsoft: tokens per watt per dollar. On Microsoft’s January 2026 earnings call, Satya Nadella said “the key metric we are optimizing for is tokens per watt per dollar.” It measures output per unit of cost. Revenue isn’t in it.
- Investors: revenue per megawatt. Tomasz Tunguz and Pantera Capital both frame AI labs as buying power wholesale and reselling it as cognitive work. Pantera estimates that model companies like Anthropic generate more than $40 million of revenue per megawatt per year. These are investor estimates, not company-reported metrics.
Everyone is circling the same question: what do you get back for each unit of compute? Investors measure it in megawatts. Microsoft measures it in tokens. OpenAI measures it in gigawatts and margins. Anthropic is the only one I found that answers it in dollars, against GAAP revenue, in an SEC filing.
Inference Efficiency Ratio in 60 Seconds
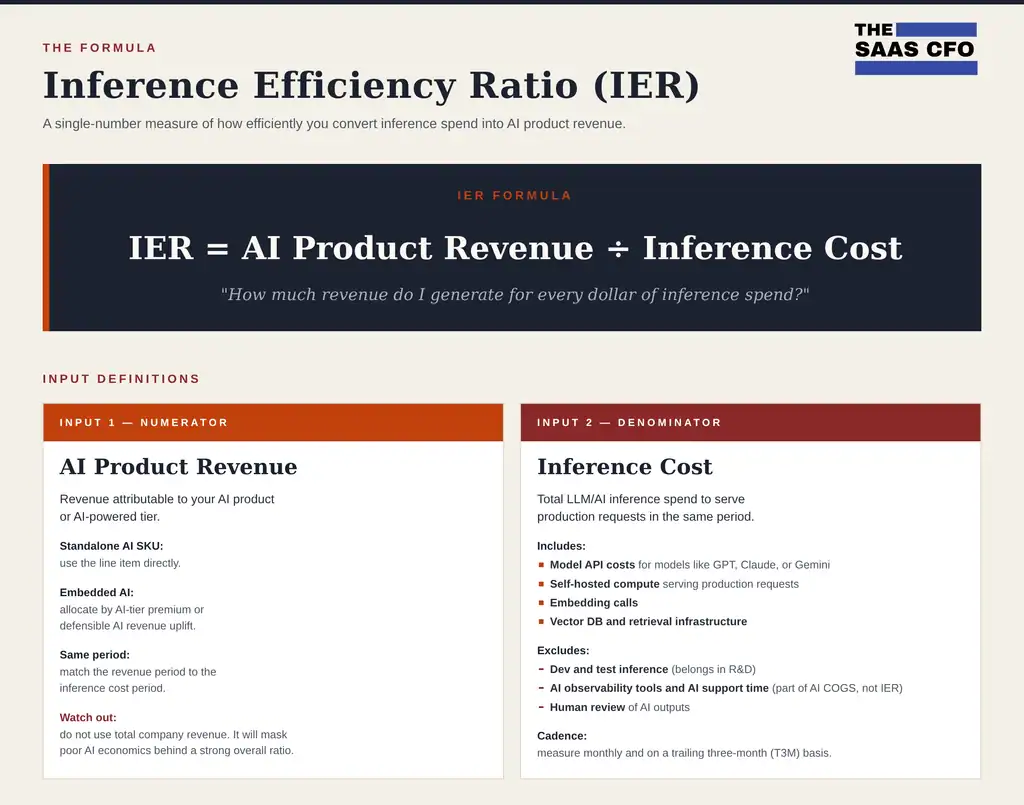
IER measures how much AI revenue you generate for each dollar of inference and related AI infrastructure costs.
Inference cost is the compute that serves production requests. That means model API fees, self-hosted serving compute, embeddings, and retrieval infrastructure. Dev and test inference belongs in R&D, not IER.
For AI-native companies, my draft benchmarks are simple. Below 3:1 is a warning. 4:1 is the target floor. 5:1 or higher is healthy.
One related number matters here. 1 − (1 ÷ IER) is your gross margin ceiling if inference were your only COGS.
Computing Anthropic’s IER
Anthropic doesn’t show COGS on its income statement. In 2025 it switched to presenting expenses by type, like compute and personnel. But Note 8 still breaks expenses out by function, including COGS.
The S-1 says “substantially all” of that COGS line is compute and infrastructure for customer-serving workloads. The rest are some personnel and allocated overhead. That’s the closest thing to inference cost in the filing.
| Period | Revenue ($M) | COGS ($M) | IER | Total compute ($M) | Revenue ÷ total compute |
| H1 2026 | 16,286 | 2,380 | 6.8x | 8,945 | 1.82x |
| H2 2025 | 3,422 | 1,754 | 2.0x | 4,992 | 0.69x |
| H1 2025 | 1,163 | 1,019 | 1.1x | 2,334 | 0.50x |
| FY 2024 | 386 | 752 | 0.5x | 2,522 | 0.15x |
H2 2025 is FY 2025 less H1 2025. Total compute is the “Compute and infrastructure” line on the income statement.
In the first half of 2026, Anthropic’s IER was about 6.8 to 1. That clears my 5:1 healthy line for AI-native companies. A year earlier it was about 1.1 to 1, deep in the warning zone.
The swing came from revenue growing about 14x while customer-serving COGS grew about 2.3x. Flip it around and inference cost was about 15% of revenue. That puts the gross margin ceiling at about 85%. In OpenAI’s language, that’s about an 85% compute margin against OpenAI’s reported 70%. The definitions differ, so treat that as directional.
Note the gap between the two ratios, too. COGS was only about 27% of total compute in H1 2026. Most of Anthropic’s compute bill goes to building the next model, serving free users, and internal use.
Here’s the same bridge for IER, using net revenue in the numerator.
Caveats Before You Benchmark Against This
- Gross revenue lifts the numerator. 48% of revenue flows through cloud marketplaces and is booked gross. The channel partner fees sit in sales and marketing. I estimate them at about $2.8 billion in H1 2026 from the S-1. Net those out and IER drops to about 5.7 to 1. Still healthy.
- Free users aren’t in it. Compute for free access sits in sales and marketing. Count it as inference and IER goes down. The S-1 doesn’t size it.
- The split is an allocation. Anthropic runs compute as one shared pool and plans it in total. The functional split is management’s allocation, not a meter reading.
- Half-year data only. Note 8 gives annual and six-month figures, so there’s no quarterly IER.
Takeaways for SaaS and AI Operators
- Define your denominator and disclose it. Anthropic’s 2.08x and my 6.8x come from the same filing. The only difference is what sits in or out of gross profit.
- Track both views if you train or fine-tune. IER tells you if serving customers is profitable. Revenue to total compute tells you if the whole AI investment is profitable.
- Separate customer-serving compute in your GL. Anthropic could show this because it splits compute by workload. Most SaaS companies can’t yet. Set up the GL accounts now.
- Expect investors to ask for it. The first frontier lab to file for an IPO put revenue per dollar of compute in its S-1. I expect boards and investors to start asking every AI company for its version. You may not be an “AI lab” but the Inference Efficiency Ratio would be a good place to start.
Definitions
| Term | What it means in this post |
| Revenue per dollar of compute | Anthropic’s ratio from its S-1: revenue ÷ all compute and infrastructure expense for the same quarter. |
| Compute and infrastructure expense | Anthropic’s largest expense line. It covers all compute: training, research, serving customers, free users, and internal use, plus data center leases, power, and depreciation. |
| Inference | Running a trained AI model to answer a request, such as a prompt or API call. Training builds the model. Inference uses it. |
| Inference Efficiency Ratio (IER) | AI product revenue ÷ inference cost for the same period. It shows how much revenue each dollar of inference generates. |
| Compute margin | OpenAI’s internal metric, per press reports: the share of revenue left after the cost of running models for paying users. |
| AI-native | A company whose product is the AI itself, so inference is the core cost of delivery. |
| COGS | Cost of Goods Sold: the cost to deliver the product to paying customers. For Anthropic, mostly customer-serving compute plus some personnel and overhead. |
| Gross margin ceiling | 1 − (1 ÷ IER). The highest gross margin possible if inference were your only COGS. |
| Note 8 (functional expenses) | The S-1 footnote that groups expenses by function, including COGS. Anthropic’s income statement groups them by type instead. |
| Channel partner fees | What Anthropic pays cloud providers and other partners for selling Claude. Recorded in sales and marketing, not COGS. |
| H1 / H2 | First half (January to June) and second half (July to December) of the calendar year. |
Sources
- Anthropic, PBC, Form S-1 (October 26, 2026): income statement, Note 8 functional expenses, MD&A compute efficiency chart
- How to Calculate the Inference Efficiency Ratio, The SaaS CFO
- A business that scales with the value of intelligence, Sarah Friar, OpenAI (January 18, 2026)
- OpenAI compute margins, Fortune, citing The Information (December 21, 2025)
- Microsoft Q2 FY2026 earnings call transcript (January 28, 2026)

I have worked in finance and accounting for 25+ years. I’ve been a SaaS CFO for 9+ years and began my career in the FP&A function. I hold an active Tennessee CPA license and earned my undergraduate degree from the University of Colorado at Boulder and MBA from the University of Iowa. I offer coaching, fractional CFO services, and SaaS finance courses.