
Something important happened to SaaS retention in 2025. The data is in, and every SaaS CFO and founder needs to see it.
The 2026 Benchmarkit B2B SaaS & AI-Native Metrics report, one of the most comprehensive benchmark studies of private B2B SaaS and AI-native software companies, delivered a finding that should be in every operator’s inbox today.
Gross revenue retention (GRR) dropped from 88% to 84% at the median. Even the companies in the top quartile weren’t spared. The 75th percentile slid from 95% to 91%. The gold standard of 95% GRR is under attack.
This isn’t a story about a handful of companies with churn problems. This is a market-level structural shift. And the distinction matters enormously for how you diagnose your own retention profile.
I want to break down what this data means, why it’s happening, and what the best-positioned SaaS businesses are doing differently, because buried inside this benchmark shift are both a warning and a clear set of actions.
What the GRR Numbers Actually Say
Let me start with the foundational definition for those newer to this metric.
Gross Revenue Retention (GRR) measures how much ARR you retain from your existing customer base after accounting for churn and contraction. No expansion revenue is included.’
It’s the cleanest signal of your underlying retention health. Because it excludes expansion, you can’t mask a leaky bucket with aggressive upselling.
Here’s how the 2026 Benchmarkit data breaks out:
| Benchmark | Prior Year | 2026 |
| Median GRR | 88% | 84% |
| 75th Percentile GRR | 95% | 91% |
That four-point drop at the median isn’t noise. On a $10M ARR base, moving from 88% to 84% GRR means an additional $400K in annual revenue erosion, before you add a single dollar of expansion or close a single new logo. At $50M ARR, that’s a $2M hole appearing in your baseline every year. That’s a material change to your growth calculus and your valuation.
When I was creating next year’s budget, you can bet I was triple checking my churn number in my forecast/budget model. Get that wrong and you’ll live that mistake for an entire year.
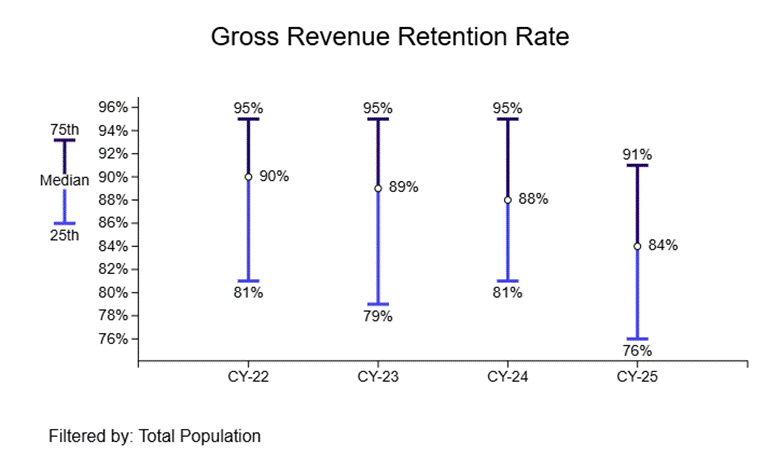
And just as interesting is the top quartile decline in CY25 to 91%. 95% has been the rule of thumb for elite GRR performance. Now, even this standard supported by years of data is taking a hit.
The Pricing Model Divide in GRR
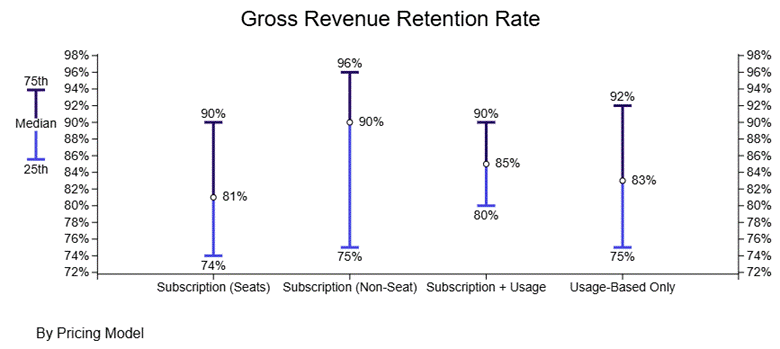
Segmenting gross revenue retention by pricing model shows another interesting data point. Seat-based pricing shows the lowest median and bottom quartile GRR numbers. The attack on seat pricing will continue.
GRR by Solution Type
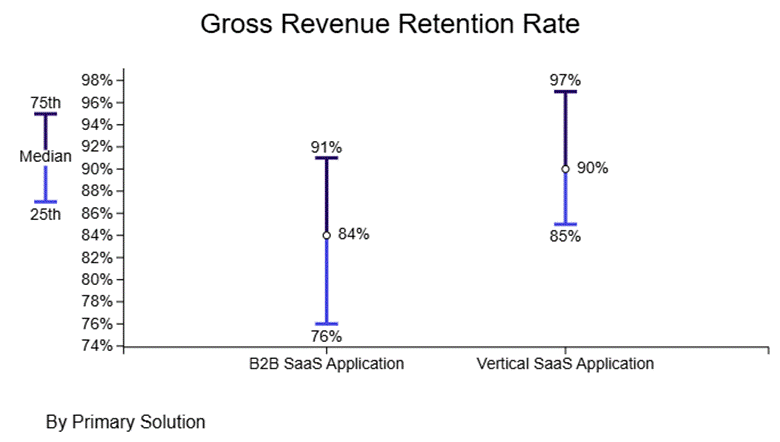
Here’s a GRR bright spot. Vertical SaaS holds a huge retention lead over horizontal SaaS.
GRR by ACV Segment
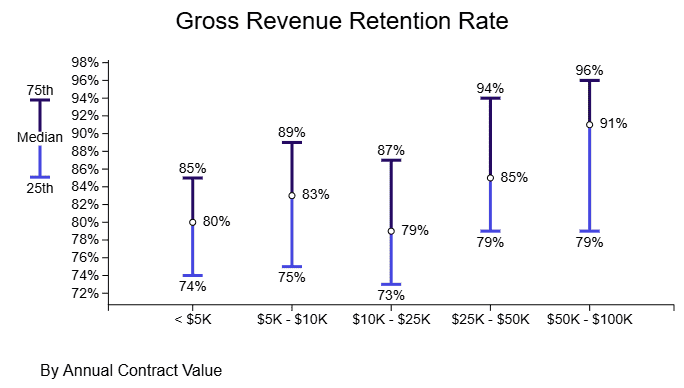
This is how I benchmark my clients. GRR expectations change based on your product’s price point. B2B and B2C also have different expectations.
This is the trend you usually see when charting by ACV. There might be some volatility in the data, but if you draw a line from the $5K segment to the $50-100K segment, it provides a good a reference range.
Why Retention Is Declining Market-Wide
Three forces are converging here and understanding them separately helps diagnose your own situation.
AI Disruption of Existing Workflows
The enterprise software buying environment shifted dramatically in 2025 and continues today. Buyers are consolidating tool stacks and scrutinizing every SaaS renewal through the lens of AI alternatives. Products that haven’t credibly integrated AI or can’t articulate their value above what an AI-native tool now provides are facing increased pushback at renewal.
This is the retention dimension of the broader SaaSpocalypse I wrote about earlier this year. When AI can automate or replicate a meaningful portion of what a $40,000/year SaaS subscription used to do, CFOs pay attention. They may not cancel immediately, but they negotiate harder, downgrade tiers, or simply don’t expand. The cumulative effect shows up in GRR and NRR compression.
Seat Rationalization from Leaner Teams
AI productivity tools have enabled companies to run leaner teams. Fewer employees mean fewer seats. That’s the whole “death of seat pricing” thesis.
If your GRR is tied directly to headcount at customer accounts, and those accounts reduced headcount by 15% through AI-assisted work, your revenue followed, even if your product didn’t lose a single competitive deal.
This is the most dangerous form of GRR erosion because it doesn’t look like churn. 100% logo renewal rate you say. No one canceled. The contract just renewed at 85% of last year’s value. Multiply that across a portfolio of accounts and you’re staring at an 84% GRR without a single customer satisfaction problem.
This is like Ghostbusters where you never cross the streams. GRR numbers meaningfully fall below your customer retention numbers. You don’t see that much.
The Expansion Dependency Problem
Here’s the finding that deserves the most attention from a financial modeling standpoint, and I think it’s the one most SaaS boards haven’t fully processed yet.
Per Benchmarkit 2026: 40% of net new ARR at the median company now comes from expansion, not new logos. In the low-growth cohort, that number climbs to 44%.
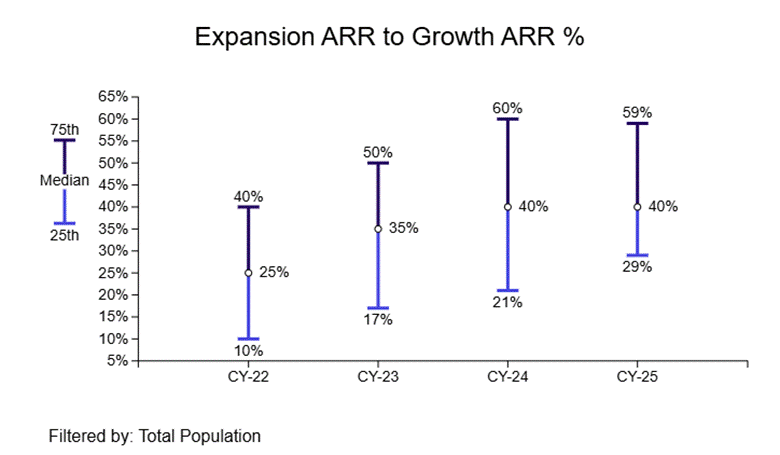
The report’s framing is precise and I want to share it directly: when expansion crosses 40% of net new ARR, it has stopped amplifying new logo growth and started substituting for it. That is a fundamentally different and more fragile growth posture. Yes, we need expansion ARR for high-growth profiles, but declining new logo velocity is never a good look.
If GRR is eroding at the same time expansion is masking it, and expansion dependency is rising, you have a compounding structural problem. Expansion can paper over a bad GRR number for a year or two. It can’t do it indefinitely.
How to Diagnose Your Retention Health Using My Five Pillar Framework
In my Five Pillar SaaS Metrics Framework (a 6th added for AI here) for evaluating SaaS business health, Retention sits as one of the most foundational pillars and for good reason. A company with 84% GRR and 25% new logo growth is not as healthy as it looks. The math at the unit economics level tells a different story.
Here’s the four-step diagnostic I walk through with every client:
Step 1: Segment your GRR. Don’t look at a single blended number. Break it out by customer size (SMB, mid-market, enterprise), firmographics, by cohort year, and/or by product line. You need to determine if you have segment wide GRR compression or compression on specific segments. The blended number hides the real story.
I built a tool that helps segment customers by industry if you have nothing else to go on. You just need the domain. Contact me if you need help with segmentation.
Step 2: Calculate your annual revenue erosion. Take (1 − your GRR) × your current ARR. That’s the revenue hole you’re filling from scratch every year before a single new logo or expansion dollar counts. Has that number grown year-over-year? If yes, the business is getting structurally harder to grow, not easier, regardless of what the top-line ARR chart tells you.
Step 3: Stress test your expansion dependency. If expansion accounts for 40% or more of your net new ARR, build the scenario where expansion growth slows 20% to 30%. What does that do to your net ARR growth rate? If the answer is “it becomes negative,” that scenario needs to be on your board’s radar now, not when it happens.
Step 4: Audit your pricing model alignment. The question every CFO on a seat-based model should ask is: does our pricing expand naturally when customers get more value from our product? If the answer is no, if a customer doubling their usage of your product generates exactly the same revenue as one who barely uses it, you have a structural NRR ceiling that pricing architecture can fix.
What Top-Quartile Companies Are Doing Differently
The companies holding GRR above 91%, the current 75th percentile, don’t have fundamentally different products. They have different operating systems around retention.
They treat retention as a revenue function, not a support function. Customer success is measured with the same rigor as sales. At-risk account signals are quantified and acted on 60 to 90 days before renewal, not at the contract renewal date. The companies doing this well have built the equivalent of a “retention P&L.” They know exactly what their renewal rate is by segment, by cohort, and by product, and they own it as a financial metric.
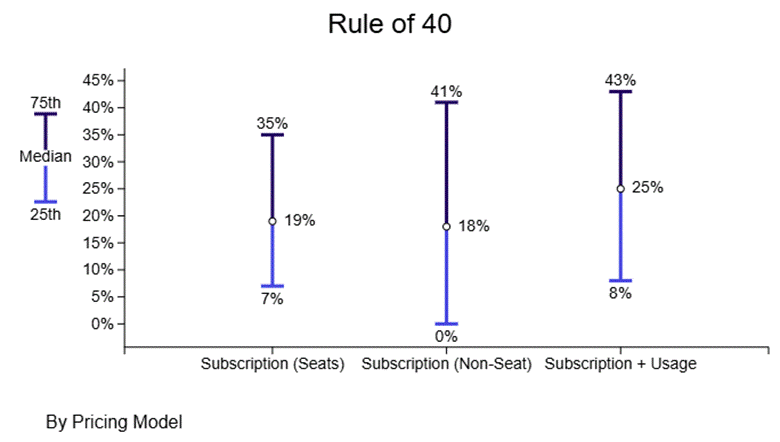
They have a usage or consumption layer in their pricing. Companies pairing a subscription base with usage-metered AI features, what Benchmarkit calls the Subscription + Usage cohort, are leading the data at 43% Rule of 40 at the 75th percentile.
The usage layer accomplishes two things: it aligns revenue with value delivery, and it creates natural expansion when customers extract more value. Intercom’s Fin AI agent at $0.99 per outcome on top of seat pricing is a real-world example of this working in production.
Do we need to re-baseline our GRR benchmarks? The 88% GRR median that defined the prior benchmarking cycle no longer exists. Companies that are still targeting 88% as their retention benchmark are running against a standard that the market has already moved past. We shall see in next year’s data.
Three Actions for This Quarter
If you’re a SaaS CFO or founder reading this, here are the three things I’d prioritize in the next 90 days.
Rebase your retention benchmarks.
Run your GRR against 84% (if you are above that number) today and stress-test 80% as a downside scenario. If you’re below median now, investors and acquirers are already applying a discount, whether they’ve said it out loud or not.
Calculate your expansion dependency ratio.
If expansion accounts for more than 40% of your net new ARR, map the scenario where that pool flattens. Does your growth model survive it? If not, you need a new logo engine that’s healthier than the expansion band currently implies.
Put pricing model on the strategic agenda.
I’m not saying everyone needs to add usage-based or outcome-based pricing tomorrow. Your pricing architecture deserves a formal review in your next strategic planning cycle. The question isn’t whether to change. It’s whether your current model has a structural ceiling you should understand before you hit it.
The companies that will exit 2026 in strong position are those who treated this retention decline as a market signal, not company-level noise, and responded with the right operating changes. The data is clear.
Additional Retention Resources
Check out my Retention bootcamp. I walk you through my exact process to create your retention schedules. Templates included.

I have worked in finance and accounting for 25+ years. I’ve been a SaaS CFO for 9+ years and began my career in the FP&A function. I hold an active Tennessee CPA license and earned my undergraduate degree from the University of Colorado at Boulder and MBA from the University of Iowa. I offer coaching, fractional CFO services, and SaaS finance courses.