CFO’s like to analyze and quantify as much as possible. Our utopia is data-driven decisions while avoiding analysis paralysis. We are known for saying “no” a lot, but really, we want to enable.
So when it comes to the Customer Success function, how do we quantify this investment? Or general investments in retention programs?
In this post, I’ll dive into:
- a short history on customer success
- how the software business changed during the shift to subscription pricing
- quantifying the layers of net revenue retention
- how to calculate ROI in NRR improvements
You can also download my template below. Video lesson coming soon.
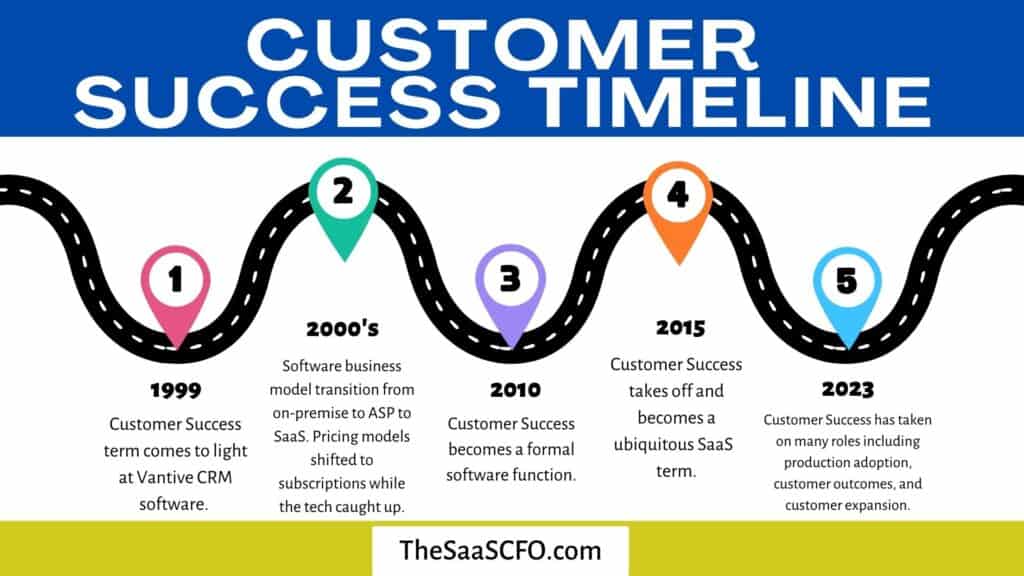
History of Customer Success
After some quick Bard and ChatGPT research, it appears that the customer success function was invented by Vantive, a CRM software company. Vantive was later acquired by PeopleSoft in 1999.
Okay, I know, you’re probably saying “don’t bore me with history.” Hang with me! This is important for understanding the transition of the software business model.
The 2000’s were a big transition as software companies moved from perpetual licensing to a subscription pricing model. This is a key pivot in how we structure our software organization.
I remember receiving an assignment in 2005 from my GM to build the first subscription pricing model for a healthcare tech business unit at McKesson. Lots of guesses! This was in the heart of the software business model transition. We definitely had tech support and professional services but no customer success department.
With the shift from one-time software sales (OTSW) to ASP to SaaS, the software business model to support our customers had to adapt. No longer was it one and done sales when we landed that new customer. We had to continually satisfy our customers and improve the product over time. The software business model had to change.
It appears that customer success was formally defined as function in software around 2010.
With an on-going obligation to provide our software as a “service”, software companies had to focus on constant support of their recurring revenue streams.
Where Does Customer Success Sit on the SaaS P&L?
This is a hotly debated topic in SaaS. There are two main functions of customer success. As a result, we see CS coded to either Customer Success in COGS or Sales in OpEx. Or both if we allocate expenses between the two departments.
I see customer success as focused on customer product adoption and better customer outcomes. But you also see CS involved in expanding existing customer accounts. They take the expansion opportunity to closed won and receive quota and commission. And in early-stage SaaS, they often do both.
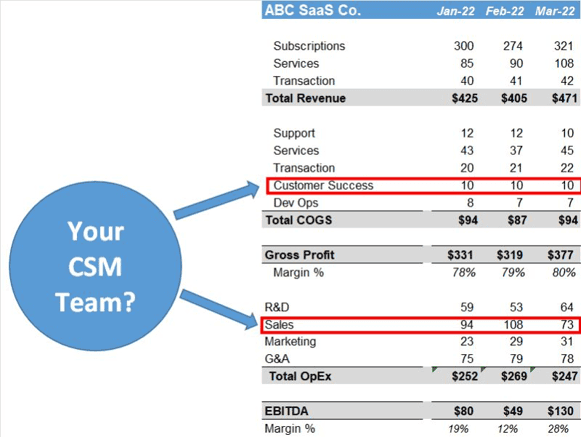
Understanding the role of CS determines how we calculate the ROI. For this analysis, I’m focused on CS in COGS and its focus on product adoption and customer outcomes.
The Customer Success North Star Metric in Net Revenue Retention
There are quite a few metrics that CS teams track. However, net revenue retention receives a lot of focus. Net revenue retention (NRR) accounts for the growth or decline in recurring revenue from our existing customer base. It factors in expansion, contraction, and churn revenue.
It does NOT include revenue from new customers.
It builds upon gross revenue retention by allowing us to offset contraction and churn (GRR) with expansion. We want a number greater than 100%.
In the old school SaaS days, this was called “net negative churn.” A confusing term which we have now simplified with NRR.
It’s very important that we can quantify each layer of MRR/ARR in our MRR schedule and in our bookings data (if applicable). Without this data, we can’t quantify CS ROI and targets.
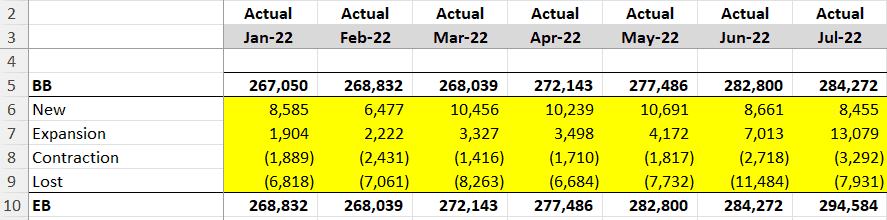
MRR Layers:
- New – revenue from new customers only
- Expansion – net incremental revenue from existing customers
- Contraction – net decrease in revenue from existing customer
- Churn – loss of the entire customer’s revenue
- BB = beginning balance, EB = ending balance
Remember, with NRR, there are two stores in one metric. We have the health of our existing customer base in GRR and we have our sales and marketing efforts focused on expansion. In this example, CS and S&M are both exerting direct efforts on our NRR number.
The expansion, contraction, and churn layers are the levers that we can pull to quantify the ROI from investments in customer success and retention.
How to Quantity Investments in Customer Success vs. Retention Improvements
I’ll admit. This is not an easy analysis which is probably why you don’t see posts covering this topic. We must dive deep into our retention layers and calculations. If you have your MRR schedule, you can replicate this analysis with my template below.
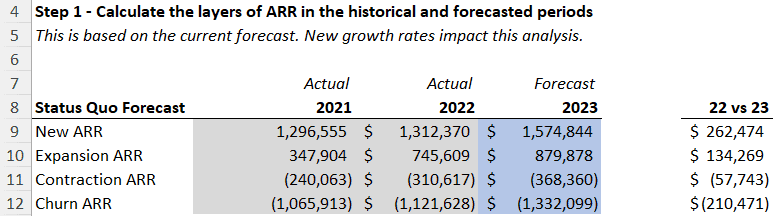
Step 1 – Quantity the Layers of ARR or MRR
First, we need to calculate our layers of ARR. This data pulls from our MRR schedule. I posted a video lesson in this free course on how to create your MRR schedule.
Aggregate revenue retention is based on these layers. And we need our base year (2022 actual in this example) versus our forecast or budget performance. This is our status quo forecast. What we expect to achieve, all things equal.
You may have a customer success or retention program or may be considering your first hire. We have to understand what we expect to achieve based on current and incremental investments.
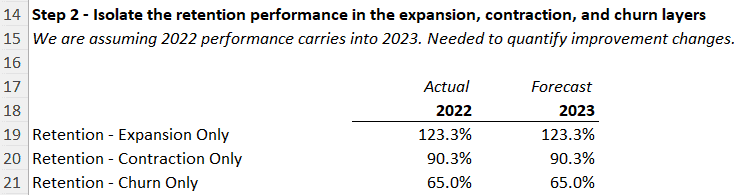
Step 2 – Quantify Your GRR and NRR Performance
Next, we calculate retention on EACH layer of our MRR. This contributes to our GRR and NRR. I’ve isolated these layers, because these are the MRR layers that we are trying to improve with retention investments.
For example, ABC SaaS Co is losing about 10% of its revenue annually through contraction. I made 2023 the same as 2022 for ease. But 2023 should reflect your status quo performance PRIOR to additional CS and retention investments. In doing this, we can then look at retention improvements versus the investment.
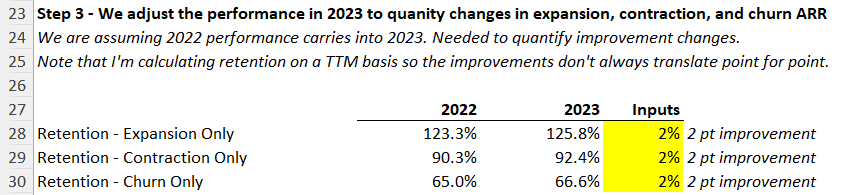
Step 3 – Input Expected Retention Improvements
Now, we play with the numbers. We change 2023 retention performance. This will lead us to Step 4 where we can quantity the dollar improvements.
I’m calculating retention on a trailing twelve basis. Normally, I calculate on a T3M and T6M and annualize.
It’s up to you on this and what time periods of retention that you will use to incent your CS team. It gets a bit tricky because new growth rates impact our base ARR number and the layers of retention for NRR.
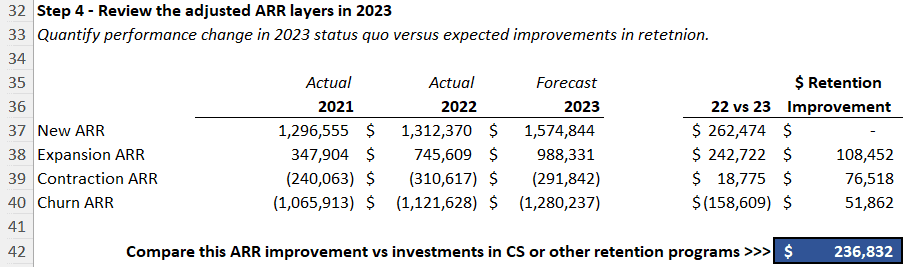
Step 4 – Quantify ARR Improvements vs. Retention Investments
This is the fun part. We can quantity the improvement in NRR versus the investments that we want to make in customer success and/or retention programs.
For ABC SaaS company, if this was our first CS hire, we’d want them to pay back their salary and benefits via improvements in retention. And then attack their retention targets and the goal of 236K in ARR improvement. Of course, there could be upside that eats into the $1M churn below.
The SaaS Fine Print
I’m performing retention on an aggregate revenue basis. New growth rates highly impact this analysis. If you are growing at great rates, it will lift the entire boat and improve your retention rates.
I’m also using a trailing twelve month period to quantify 2022 versus 2023. If you are looking at quarterly retention and annualizing, you would get different results.
Takeaways
This was a slightly more advanced analysis than I thought. But, how are you going to understand investments in retention without it?
Here’s your order of priority:
- First, make sure you can produce your MRR schedule.
- Second, calculate your aggregate revenue retention.
- Third, play with changes to your revenue retention profile in forecasted/budget periods.
- Fourth, what’s the expected ARR return?
- Compare this versus incremental investments in CS and retention.
But like anything, there are many factors at play with retention. Onboarding, tech support, product performance, etc. We want a relationship between CS and retention but we have to look at the overall picture.
And our go-to-market motion to expand our customers impacts this analysis as well. In my definition of CS for this post, CS would not be closing expansion deals but they can pass leads to our sales to create opportunity pipeline.
Download my template below.
I have worked in finance and accounting for 25+ years. I’ve been a SaaS CFO for 9+ years and began my career in the FP&A function. I hold an active Tennessee CPA license and earned my undergraduate degree from the University of Colorado at Boulder and MBA from the University of Iowa. I offer coaching, fractional CFO services, and SaaS finance courses.
The quality of the content of your blog was great. Very impressive and useful write-up. Will be waiting for more updates. Keep posting.