We make constant capital tradeoffs in our SaaS business. Even if we have a ton of cash in the bank, we still need to prioritize the investments in our business.
Investment in our product roadmap is a constant discussion. Are we fixing technical debt, responding to whimsical feature requests, or investing in features and modules that can be monetized for further revenue growth?
I’m not talking about how efficient we are at coding, but rather, how efficient we are at driving new revenue via investments in R&D.
I’d like to thank a reader who pointed out the R&D Payback Ratio. This led me to a nice post by OpEx Engine on R&D investment efficiency. Lauren Kelley interviewed Thomas Huntington, a SaaS CFO, on this topic.
In this post, I’ll address two R&D efficiency metrics. I’ll start with R&D payback efficiency, the benchmarks, and how to calculate. I will also cover the R&D Index by Boston Consulting Group.
What is the R&D Payback Ratio
The R&D payback ratio measures revenue growth to R&D expenses. After some research, I think there are different ways to describe this ratio, but I’m going with the payback ratio.
This metric measures the revenue growth for every dollar of R&D expense.
It’s somewhat reminiscent of the SaaS Magic Number. With the magic number, we compare revenue growth to total sales and marketing expenses. The metric measures the revenue growth per dollar of sales and marketing expense.
R&D Payback Ratio Example
We need three inputs from our SaaS P&L to calculate the payback ratio. First, we need annual revenue for two annual periods. Second, we need annual R&D expense.
Here’s an example formula.

I like to use HubSpot as an example in my SaaS metric course, so let’s take a look at its payback ratio.
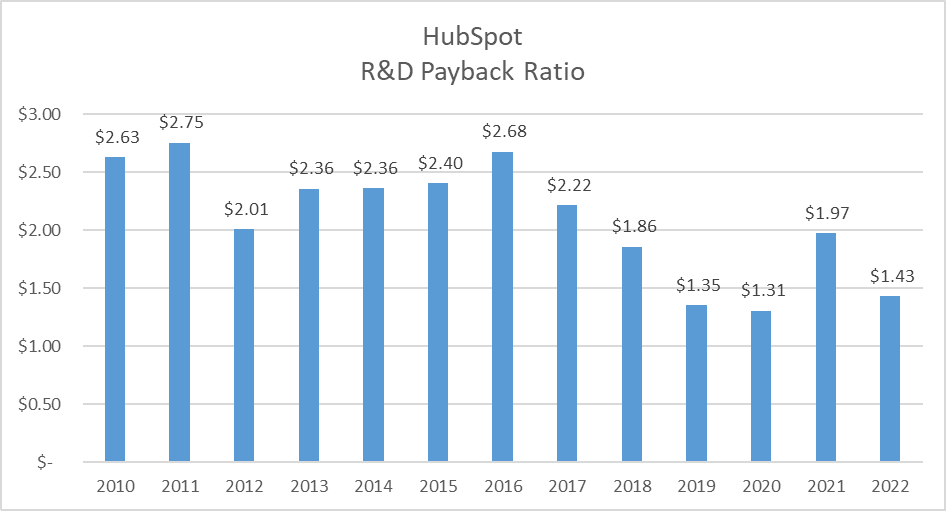
R&D Payback Ratio Benchmarks
What’s a good payback ratio? According to the OpEx Engine post, these are highlights below. I don’t know if this is backed up by data or just anecdotal. However, I calculated the ratio for one my clients and it fell consistently in the $2-3 range.
General Benchmarks per OpEx Engine Post:
- Apple has been one of the highest R&D productivity companies with a $14-15 range
- Salesforce was at $10, which is quite high for a SaaS company
- Most private SaaS companies in the $20 to $50 million range are generally in the $2 to $4 range and that’s decent.
Based on these rules of thumb, HubSpot has performed decently. However, it appears harder to maintain a $2+ ratio the larger you grow.
R&D Index by Boston Consulting Group
I stumbled upon another interesting R&D metric when researching the payback ratio. Boston Consulting Group (BCG) published an article in 2019 on the Research and Development Index (RDI).
They created this metric to study the impacts of R&D investment on revenue growth. The R&D index requires two inputs. First, we need R&D as a percentage of revenue. Second, we need organic revenue growth percentage.
They developed some benchmarks based on an analysis of public software companies. I’m not sure how they excluded inorganic growth but let’s run with it.
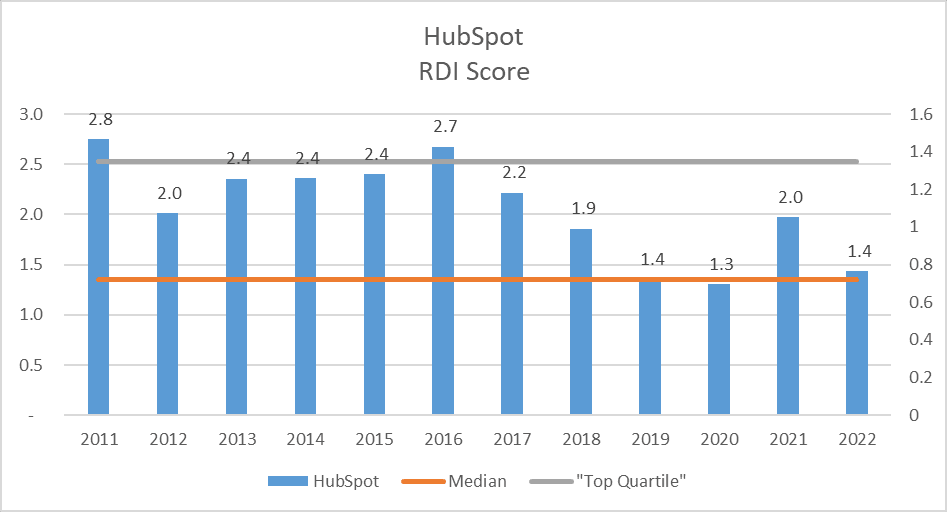
HubSpot’s R&D Index
I calculated the R&D index for HubSpot below. The results kook shockingly like the R&D Payback Ratio.
The R&D Index formula is below.
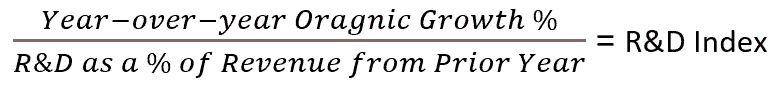
Based on this formula, it accomplishes the same performance measurement as the R&D Payback Ratio.
R&D Investment Efficiency Considerations
We can easily calculate these two metrics from our SaaS P&L data. Of course, with public company data, we do not know how much R&D is being capitalized on a gross annual basis. And there could be different capitalization policies in place.
We could also have the impact of stock-based compensation running through R&D expense in public company financials.
Also, there are many factors that drive revenue growth. R&D is, of course, an important factor. But what if we haven’t quite figured out our go-to-market motion? Or we have a great product that we don’t know how to sell? R&D investment is one piece of the puzzle.
Summary
I do believe it’s worthwhile to calculate these R&D investment efficiency metrics for your SaaS business. But that is just one data point, we need to look at entire our SaaS metrics picture to bring better context to R&D efficiency metrics.
The R&D efficiency metrics may also bring better to context to our traditional SaaS metrics.
I have worked in finance and accounting for 25+ years. I’ve been a SaaS CFO for 9+ years and began my career in the FP&A function. I hold an active Tennessee CPA license and earned my undergraduate degree from the University of Colorado at Boulder and MBA from the University of Iowa. I offer coaching, fractional CFO services, and SaaS finance courses.
R&D Index and R&D payback ratio should be equivalent. If you divide prior year revenue in both numerator and denominator of the R&D payback ratio equation, you should get the R&D index equation, no?
Yes, comes out the same for me.