When I was a CFO at a private equity (PE) backed company, I was always a little envious of the PE folks. They got so many investment looks at different SaaS companies. And they built their SaaS muscle through the management of their SaaS portfolio companies.
That’s changed now that I’m a fractional SaaS CFO. Every week, I hop on my well-used Zoom account and speak with a lot of SaaS founders and finance teams. It’s truly amazing to see all the shapes and sizes of today’s SaaS companies.
Some are performing really well, reaching PE buyout territory. And some are struggling with growth and cash.
The point is, not every company is rocking 100% growth, 80%+ gross margins, high cash balances, and low customer acquisition costs (CAC).
But what if your cash balance is falling and your CAC is increasing? Or revenue growth has flattened, and CAC is increasing? How do you know that your financial profile is changing before your eyes?
In this post, I will walk you through my framework of how I assess a SaaS company’s customer acquisition cost (CAC). Then, based on the CAC profile, what should we consider to improve our financial performance.
The Inputs Required for CAC
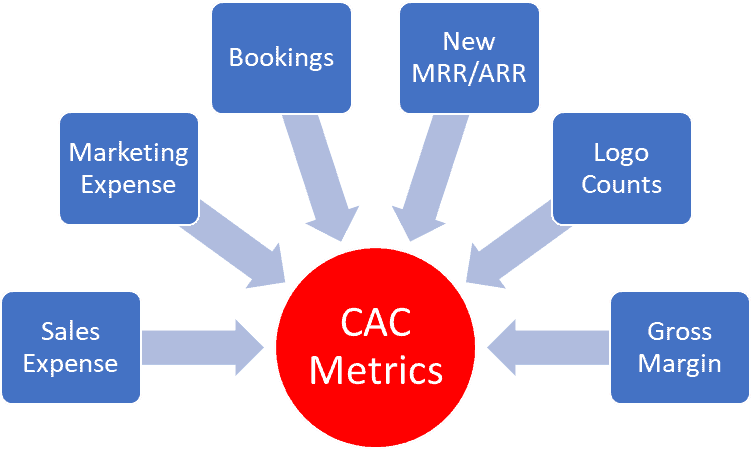
Before we dive into my CAC metrics framework, let’s review the inputs required for CAC calculations. These are not the inputs for just one formula, but an inventory of data we require for a comprehensive CAC assessment.
The bullets below outline the data required for a comprehensive CAC review. And it should act as your monthly data guide. Quick notes on the following inputs:
- Sales Expense – fully-burdened expenses attributable to sales. Wages, taxes, benefits, travel, commissions, internal-use software (CRM), training, etc.
- Marketing – fully-burdened expenses attributable to marketing. Wages, taxes, benefits, travel, paid ads, conferences, brand, swag, internal-use software (ESP), training, etc.
- Bookings – executed contracts for our products and services tracked in our CRM software.
- New MRR/ARR – if we don’t track bookings in our CRM system and offer a low-price point, self-service, we need to track the “layers” of our MRR each month. This includes new, expansion, contraction, and churn MRR.
- Logo Counts – in addition to dollars, we must track the number of new and lost customers/users each month. It also helps to track the number of expanded and contracted customers each month.
- Gross Margin – many SaaS metrics are gross adjusted. We need our overall gross margin and recurring gross margin.
How to Assess Your CAC Performance
With data in hand, we can analyze our CAC performance. I calculate the metrics listed below for my initial and on-going assessment of sales and marketing efficiency.
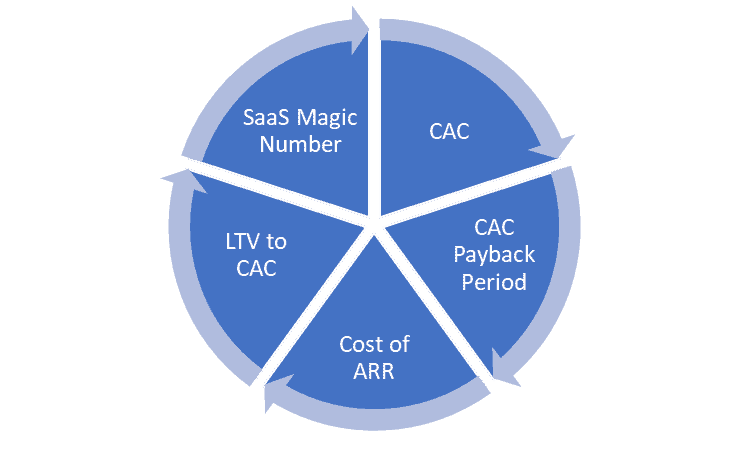
I added hyperlinks below to the individual blog posts explaining each metric. This post would be way too long if I explained the details of each CAC metric below.
- Customer Acquisition Cost (CAC) – our fully-burdened sales and marketing expenses dedicated toward new customer acquisition. We calculate on a unit basis by dividing by new customers or users acquired.
- CAC Payback Period – once we have our CAC, we can calculate the numbers required to payback the upfront CAC. This can be calculated using unit-based CAC and dollar-based CAC.
- Cost of ARR (aka SaaS CAC Ratio) – we compare our sales and marketing expense against the new ARR or MRR that we are acquiring. We calculate on a blended, new, and expansion basis. Great benchmarks available for this metric.
- LTV to CAC – we want our customer lifetime value to be at least 3x our CAC.
- SaaS Magic Number – we compare our annualized revenue growth to our previous quarter’s sales and marketing expense. More applicable for companies with short sales cycles.
As a fractional SaaS CFO, I calculate the metrics above to determine where the SaaS company stands in efficiency. Of course, it’s not always easy getting to these numbers. Often, only a portion of the data is available. If that’s the case, we implement a monthly data routine to track the components that feed our CAC metrics.
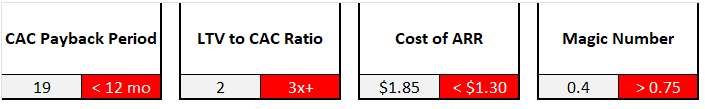
With a finely honed data routine, we can produce a monthly metrics dashboard like in the snippet below and compare against industry benchmarks.
The Wholistic CFO View
Metrics are more powerful when used together. In isolation, they offer less context. Assessing the CAC metrics above will provide a good idea of our sales and marketing efficiency.
Metrics are more powerful when used in context.
But we can’t stop there! I need to review our entire financial profile to determine what’s working and what’s not working. In additional to the CAC metrics above, I must also understand the following.
- Revenue trends
- Gross margins by revenue stream
- Churn and retention
- Cash runway
- OpEx profile
- Headcount efficiency
With a complete financial picture, I can grade our financial performance and determine the urgency of our next steps.
How to Make Changes
Okay, we’ve run our assessment and maybe things are not where we want them to be. Cash runway is a major overlay on this exercise.
If our cash runway is less than twelve months, it’s time to take immediate action. If new funding is not in our future, we must itemize the steps required to preserve our cash. Cash preservation comes in the form of expense delays and expense cuts.
Cash runway dictates the urgency in which we need to change our financial profile for the better.
If our CAC is out of control, I recommend pausing any increase in sales and marketing spend. We must dig into our data. We start with the aggregate data picture but then must dive into customer segments. Do we have any customer acquisition channels that are working? If so, let’s continue to invest there and pull back in other channels. Finance must work closely with their sales and marketing leaders in this exercise.
We must be careful, however, with cuts in sales and marketing. If we do delay or cut, we must calculate the impact on our pipeline and revenue and adjust the forecast accordingly.
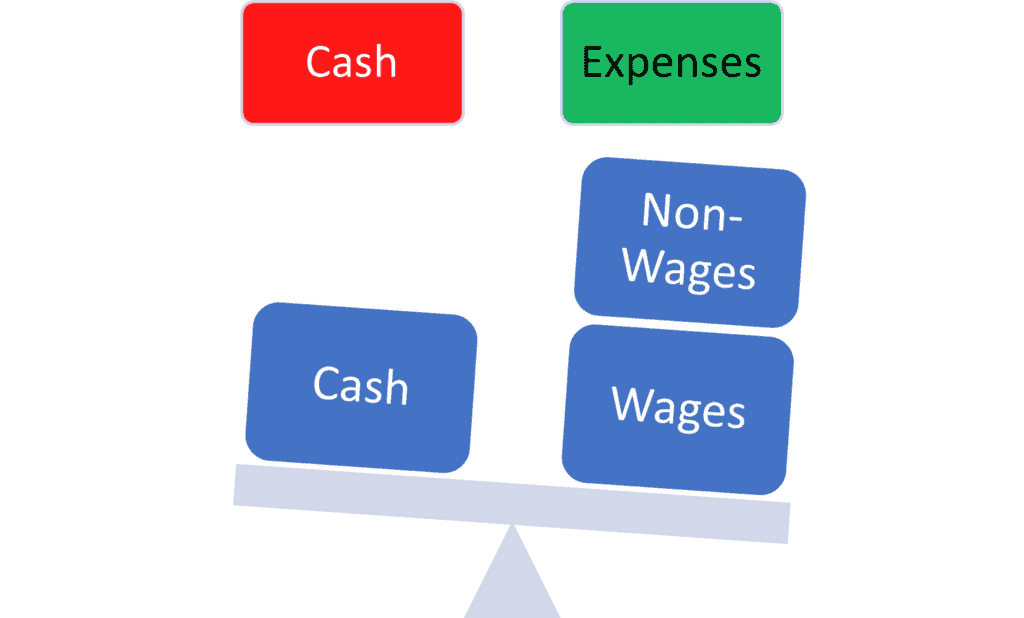
Outside of sales and marketing, we can delay new hires, new contractors, major non-wage investments, travel, and consulting projects. As a last step and when we are desperate for cash, we must reduce headcount and contractors.
It is finance’s job to itemize the delays and cuts. It’s a menu of future action items for our leadership. If A happens, we do this. If B happens, we do that.
However, when things are dire, most of the expenses on our SaaS P&L are employee-related. That’s the focus of the majority of the expense cuts.
You can download my CAC metrics templates below. This will kickstart your data and metrics process. You’ll realize immediately if you have good, bad, or no data. Start now. It’s never too late.
Cost of ARR Template
CAC Template
CAC Payback Period Template
Magic Number Template
I have worked in finance and accounting for 25+ years. I’ve been a SaaS CFO for 9+ years and began my career in the FP&A function. I hold an active Tennessee CPA license and earned my undergraduate degree from the University of Colorado at Boulder and MBA from the University of Iowa. I offer coaching, fractional CFO services, and SaaS finance courses.
Question: if you hear the phrase “Our Company has a 6-9 month sales cycle” do you look at CAC 6-9 months prior and divide it into current month bookings?
Hi Bob, yes, very important to line up your period of measurement with your average sales cycle. Then I measure on a rolling basis.
This is super useful. Thanks!