Almost everyone in SaaS has heard of the LTV to CAC ratio. And almost everyone has heard that we should target an LTV to CAC ratio of at least three. This was popularized (I believe) by the great content published by David Skok on SaaS metrics.
But what does it mean to have an LTV to CAC ratio of three? Or less than three? We know that we want an LTV to CAC ratio of greater than three, but what is so special about three? What does it mean for your business? Obviously, lots of questions here.
In this post, I’ll review CAC (customer acquisition costs), customer lifetime value (LTV), and the inputs that affect the outcome of the LTV to CAC ratio. I’ll create two financial scenarios, so that we can understand how a decrease in LTV to CAC affects the finances of our SaaS business.
What is CAC
First, a quick primer on CAC and LTV. CAC is the total sales and marketing expenses associated with acquiring one new customer. Customer Acquisition Costs (CAC) is a key metric to understand for any SaaS or subscription-based business.
To calculate CAC, you simply divide sales and marketing expenses (allocated for new acquisition efforts) by the number of new customers won. To read more about CAC, check out this post.
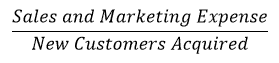
In isolation, CAC does not mean much, but used in conjunction with CLTV (customer lifetime value), it is a much more powerful and MEANINGFUL metric.
What is LTV
Customer lifetime value (CLTV or LTV) is the revenue or margin that you receive from one customer over the lifetime of that customer. It’s a point in time calculation. Meaning, if you expand that customer later, it is not factored into your initial LTV calculation.
You need three inputs for the common calculation of this formula. You need your latest, average revenue from newly acquired customers, your recurring gross margin, and your revenue churn. In the formula below, ARPA is average revenue per account.
You can calculate this using MRR or ARR but make sure churn is also in a monthly or annual format.

Just like CAC, understanding LTV is more meaningful when compared to another metric. Just like peanut butter and jelly, we compare LTV to CAC.
The Influences on LTV to CAC
LTV to CAC seems like such a simple concept. In practice, you must track six metrics or numbers to calculate LTV to CAC.
I summarized the variables below in what I’ll call the LTV to CAC influence bubble. As you can see, there are many forces at play.
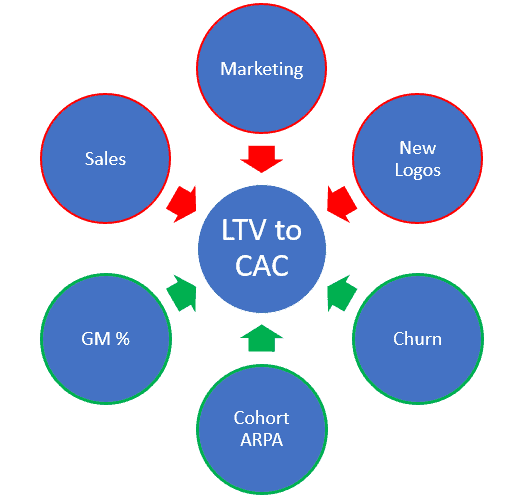
If we are trying to understand why our LTV to CAC is good or bad, we must review seven (yes, seven!) areas on our P&L plus our bookings numbers. It stresses the importance of understanding the financial profile your business. What is working in your business? And what is not working that requires our attention.
The red arrows indicate inputs and influences on LTV to CAC.
Next, I’ll review three LTV to CAC scenarios. There are many ways to perform this analysis, but I’ll focus on two scenarios that affect the top and bottom half of our SaaS P&L.
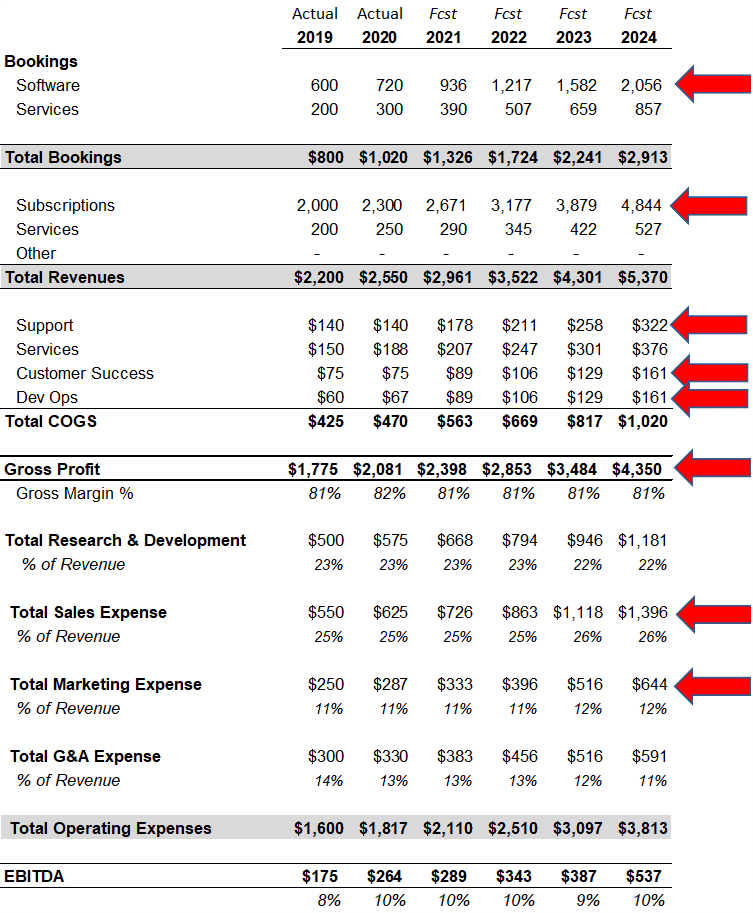
Base Case – Solid Financial Profile
For the base case, I’ve modeled a growing SaaS company with a very solid financial profile (see SaaS P&L above). I outlined some of the key financial points for this company below.
In this case, we have a healthy business and an LTV to CAC ratio of well above three.
Base Case Financial Profile
- Gross Margin %: 81%
- EBITDA Margin %: 10%
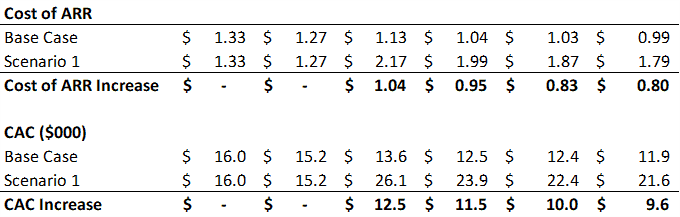
- Cost of ARR: $1.33 to $0.99
- CAC: $16.0K to $11.9K
- LTV: $104K
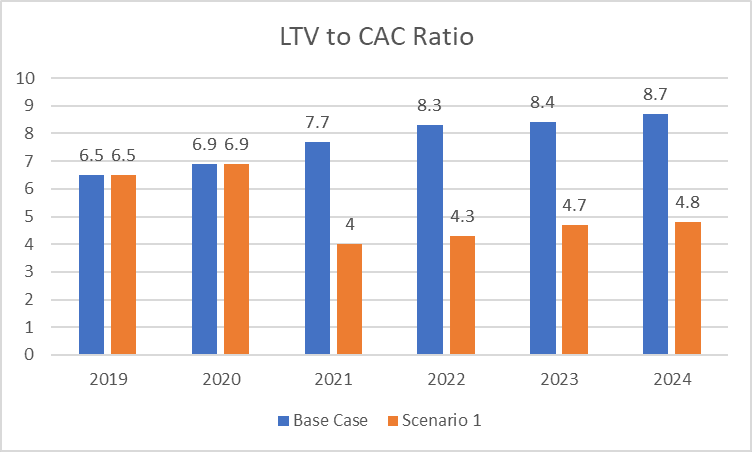
- LTV to CAC: 6.5x to 8.7x
- CAC Payback Period: 19 months to 14 months
- Rule of 40: 26% to 35%
We will assume that we are managing the base case company and then we change our financial profile in the forecasted periods to create scenarios one and two.
Scenario 1 – Inefficient Sales and Marketing
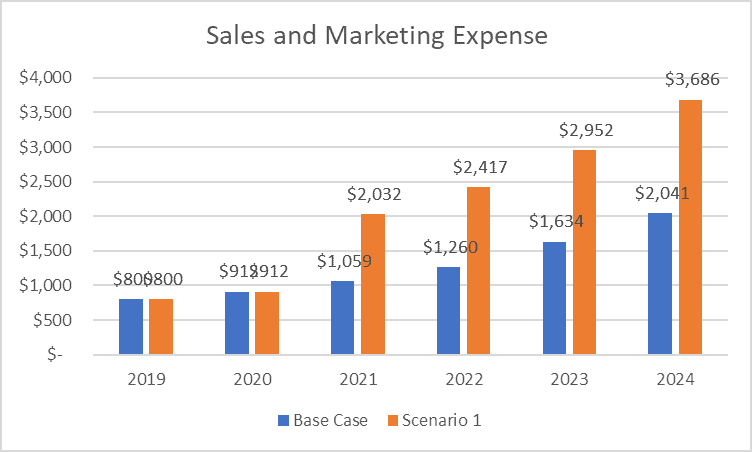
Let’s affect LTV to CAC by changing two of the six inputs from the LTV to CAC bubble above. To model scenario one, I am using the base case profile, but I increase sales and marketing expenses to decrease LTV to CAC. I hold all other numbers and assumptions the same. Essentially, in this case, we have become very inefficient in sales and marketing.
We still acquire the same new ARR and customers, but it takes many more dollars to acquire the same set of customers. I summarized the sales and marketing expense changes in the chart below.
The Result of Inefficient Sales and Marketing
With a dramatic increase in sales and marketing expense, our LTV to CAC ratio was reduced by almost half in the forecasted periods. Our cost of ARR and CAC almost doubled to dangerous levels. Very inefficient ARR acquisition.
Ok, great, my metrics are bad. What else does this mean to me? We have inefficient sales and marketing but what else is affected?
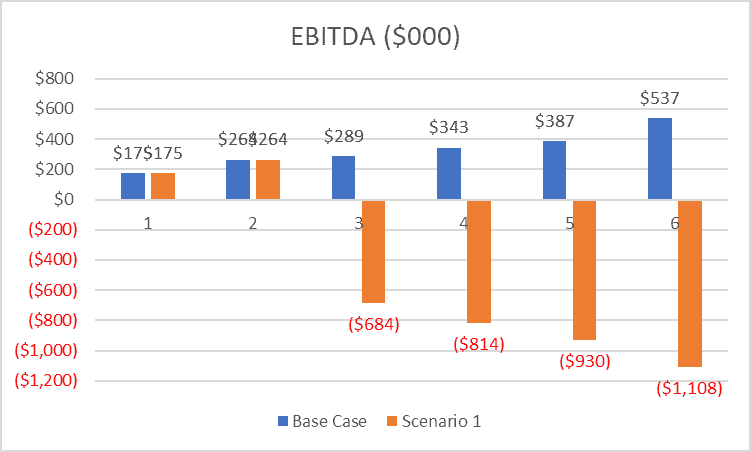
With the operating expense (OpEx) increase, our profitability and EBITDA margins drop by very large amounts. We swing from almost a Rule of 40 company to negative margins and negative cash flow.
EBITDA is earnings before interest, taxes, and depreciation. It’s a good proxy for cash flow in the long run, and most likely a major focus when you are scaling beyond $5M in ARR.
My LTV to CAC Takeaway – Scenario 1
In scenario one, I isolated the changes on LTV to CAC by adjusting sales and marketing expenase located in the OpEx section of our SaaS P&L. Remember, our business still has great gross margins and retention. The “top half” of our P&L is performing well.
However, our profitability was highly affected by a declining LTV to CAC ratio. Of course, big changes in sales and marketing expense do not happen overnight, but they can creep out of control over many months.
Scenario one reinforces the importance of understanding the financial profile of your business. If you see sales and marketing metrics move in the wrong direction, I would call my sales and marketing leader to understand current performance. And more importantly, where is performance going in the future.
Finance should have a tight relationship with sales and marketing.
Forecasting is a key component of financial discipline. It helps you understand what is financially working and not working in your business. You can answer questions such as:
- When can I hire?
- When can I invest in new product or resources?
- What is the impact of these operational decisions?
With forecasting, you can be proactive.
Metrics are more meaningful when used with other metrics, never in isolation.
Scenario 2 – Increased Churn and Gross Margin Pressure
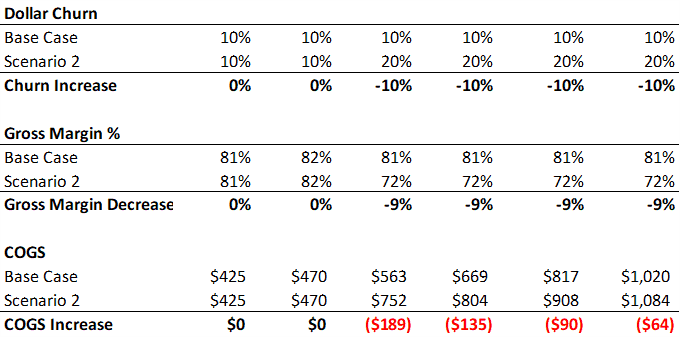
Now, let’s affect the other half of the LTV to CAC bubble above. We keep the same sales and marketing efficiency as the base case, but now we increase dollar churn and increase COGS.
These changes affect the “top half” of the P&L. Our revenue and gross margins decrease due to increased dollar churn and a lower gross margin. You can see from the chart below, our LTV to CAC is cut in half.
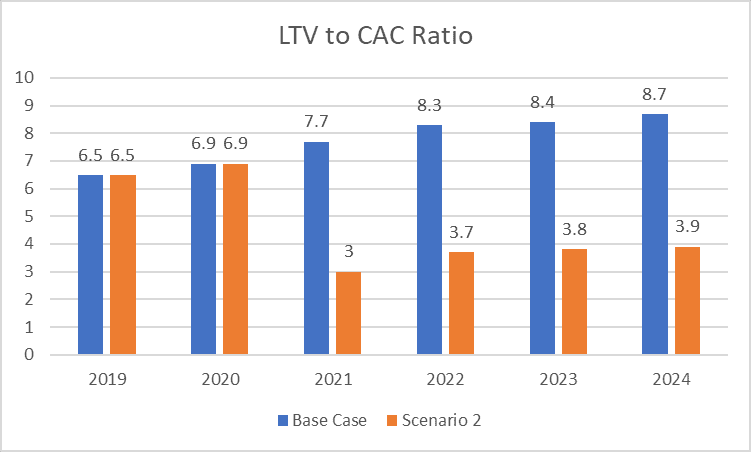
You can see from the tables below, I increased churn from 10% to 20% and added more expenses to COGS. In trying to decrease our LTV to CAC, I was actually surprised by the limited COGS increase needed to drive down the ratio. A 10 point increase in churn had a large impact on gross margins.
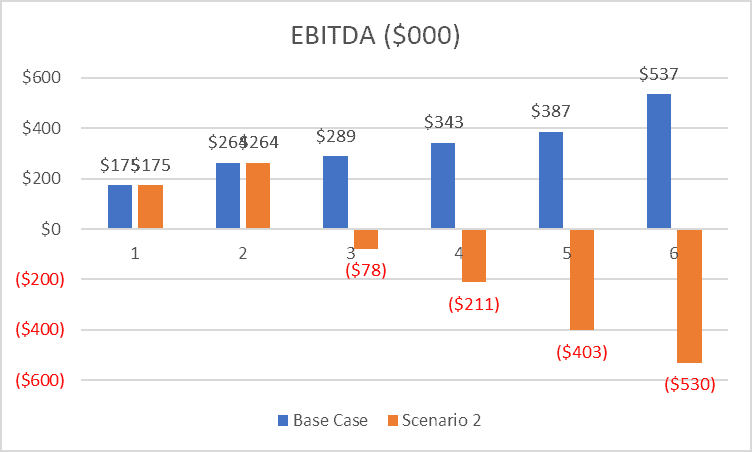
Finally, you can see our EBITDA decline below. Not as dramatic as scenario one but a simple change in churn was all it took to drive LTV to CAC close to three.
My LTV to CAC Takeaway – Scenario 2
A simple increase in churn was the primary reason for our decline in LTV to CAC in scenario two. But it left me thinking about the EBITDA impact. Why did EBITDA not decline as severe as in scenario one?
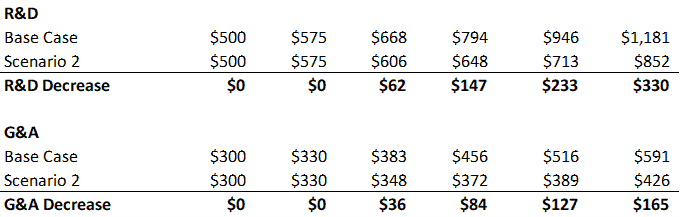
In scenario two, I assumed that R&D and G&A continued to stay “optimized” at the same percent of total revenue. As revenue declined on the churn increase, R&D and G&A expenses also declined.
In the long run, this is possible if we stay financially disciplined and have spend targets set by an annual budget process. But in the short term, it’s unlikely we could cut expenses in tandem with a rapid decline in retention.
This stresses to me the living nature of the P&L and how, as leaders of our SaaS business, we must understand the macro economics of our business. How one force in the business may affect others.
We must understand our:
- Gross margin and margin by revenue stream profiles
- Our OpEx profile (spend as a % of total revenue)
- Our operating leverage
Conclusion
I ran just two scenarios, but there are so many ways to take this analysis. Does an LTV to CAC ratio of three mean a definitive $X in financial results, I don’t think so. There are too many variables.
However, I do think three is a good rule of thumb. If we are in a declining LTV to CAC situation, the warning sirens should be sounding. We may be facing major financial damage.
If we are at an LTV to CAC of below three, we probably already understand that we must work towards gross margin and sales/marketing efficiency.
If you’d like to model your numbers, download the free templates below.
I have worked in finance and accounting for 25+ years. I’ve been a SaaS CFO for 9+ years and began my career in the FP&A function. I hold an active Tennessee CPA license and earned my undergraduate degree from the University of Colorado at Boulder and MBA from the University of Iowa. I offer coaching, fractional CFO services, and SaaS finance courses.
Hi Ben
Thanks for a very detailed explanation of the LTV-to-CAC model with different scenarios. I would like to ask what kind of “Dev Ops” expense that you add in the COGS?
Thanks.
Hi Hana,
Dev Ops includes hosting (AWS, Azure, etc.), third-party products embedded in your product (for example, Twilio for messaging), staff managing your hosting infrastructure, other hosting such as domain and SSL costs.
Ben
Hi Ben
Thanks for your useful article. I dropped a question here some days ago but not sure why it disappeared. I went through the model and was wondering what kind of “Dev Ops” cost are included in the COGS?
Have a great day.
Hi Van,
Dev Ops includes hosting (AWS, Azure, etc.), third-party products embedded in your product (for example, Twilio for messaging), staff managing your hosting infrastructure, other hosting such as domain and SSL costs.
Ben
Great write up. The LTV cohort model you represent is handy to have but doesn’t it spit out bad lifetime revenue numbers (goes to infinite) when logo retention and GRR is less than 100% but NRR is > 100%? There should be a factored ACV lift for accounts that don’t churn (i.e. GRR is 87% but of the customer who don’t churn, the average uplift is 22%) that doesn’t look represented here.
Also curious why you’re not showing a DCF model given customer life can reach out 5+ years? Throws off the LTV:CAC ratio of 3 as being the ideal benchmark (would be lower depending on the discount rate) but gives the Founder a more accurate representation of the NPV of each marginal customer in the install base.