On the surface, the traditional SaaS P&L looks as clean and predictable as it did five years ago. You have recurring subscription revenue, your cost of goods sold (COGS) is represented properly, and your operating expenses (OpEx) are categorized as R&D, S&M, and G&A.
But underneath the hood, AI is completely changing the financial rules. You cannot not act.
If you are a SaaS founder, CFO, or finance leader, and you have not actively updated your chart of accounts to reflect the unique cost structures of AI, you will be running blind.
Whether you are building an AI-native product or embedding AI features into a legacy software, co-mingling these costs with your traditional cloud infrastructure or software licenses will distort your true gross margins.
In my work with software founders and as a fractional CFO, I’m beginning to this oversight.
In this post, let’s dive into how AI is changing SaaS unit economics, why traditional accounting models fail in the AI era, and how to step-by-step “SaaSify” your chart of accounts (COA) to maintain financial clarity and defend your valuations.
Why AI Costs Distort Traditional SaaS Unit Economics
To understand why your current SaaS P&L is failing you, we have to look at the historical benchmarks. In traditional SaaS, subscription gross margins have long been the gold standard of business efficiency.
The 2026 Aleph x Benchmarkit SaaS & AI Metrics Report (full-year 2025 data across 342 private B2B SaaS and AI-native companies) shows that the median software gross margin sits firmly at 80%, with top-quartile performers achieving 86% or better. Worth noting: that same report found AI infrastructure costs have not yet compressed the software gross margin at the median. The compression shows up in AI-native cohorts, not in the broad market average.
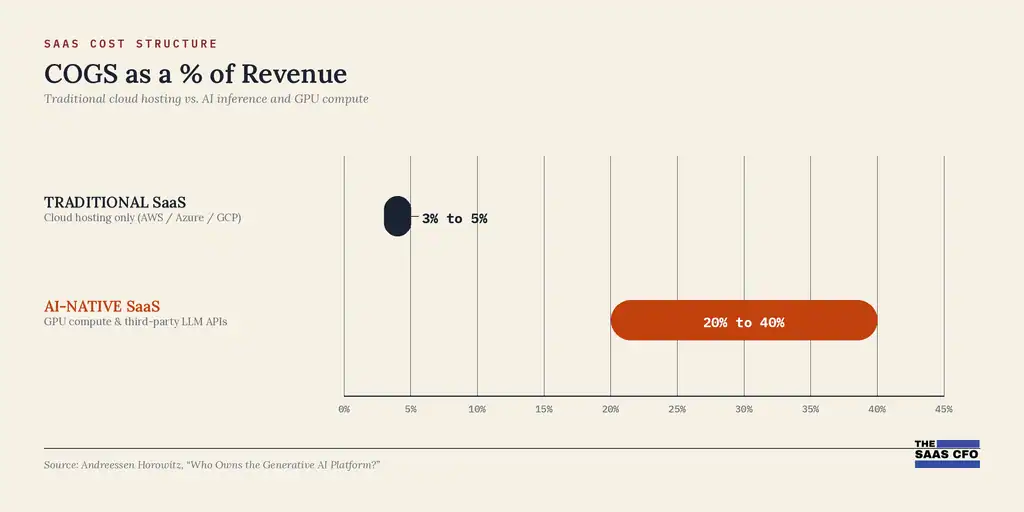
Historically, once you built the software, the marginal cost to deliver it to the next new customer was close to zero. Traditional application hosting (AWS, Azure, GCP) rarely exceeded 3% to 5% of revenue, and the rest of COGS was customer support, customer success, ad professional services.
AI-native and AI-embedded software models break this assumption.
Andreessen Horowitz’s analysis of the generative AI market estimates that app companies spend around 20% to 40% of revenue on inference and per-customer fine-tuning, paid either to cloud providers directly or to third-party model providers. That compute expense drag is why a16z sees gross margins for AI app companies clustering as low as 50% to 60%, even though a handful of outliers reach 90%.
This lines up with what other benchmarks are showing. ICONIQ’s 2026 State of AI data puts average AI product gross margins at about 52%, up from 41% in 2024. From Bessemer’s 2025 report, AI-native SaaS is running at 50% to 65% gross margin at maturity, with early-stage AI-native companies frequently running 25% to 30% before they reach scale.
I think the verdict is still out on AI margins. I think we’ll return to SaaS expectations.
If you are co-mingling these AI compute expenses with your standard hosting or burying them inside your R&D lines as “development tools,” you are committing two critical financial sins:
You are distorting your core SaaS Gross Margins (Pillar 3 of my Five Pillar Framework). You cannot accurately price your product, measure unit economics, or determine your customer lifetime value (LTV) if your baseline COGS is incorrect.
You are inviting severe adjustments during due diligence. Buyers do not value service-heavy or compute-heavy businesses the same way they value pure software. If an M&A buyer cannot easily audit your clean, non-AI software gross margins versus your incremental AI gross margins, they may underwrite your business at a lower multiple.
Start de-risking your financial profile with the properly SaaSified P&L.
The Five Pillar Metrics Framework: Where AI Fits
If you’ve taken my SaaS Metrics or AI Metrics courses, you know that I organize the financial health of a software business around my Five Pillar SaaS Metrics Framework:
- Growth (Is your ARR getting bigger, and what is the mix of new vs. expansion?)
- Retention (Are you keeping what you’ve built, measuring both Gross and Net Revenue Retention?)
- Gross Margins (Is your core business model healthy and scalable?)
- Financial Profile (Are you balancing growth and profitability via the Rule of 40 and EBITDA?)
- Sales & Org Efficiency (Are you acquiring customers and deploying headcount efficiently?)
AI directly impacts every single one of these pillars.
Under Pillar 1 (Growth), we are seeing a real shift, though the gap is not as extreme as some headlines suggest. High Alpha’s 2024 SaaS Benchmarks Report found AI-native companies growing at almost 2x the rate of horizontal SaaS peers (about 50% vs. about 28%). Under Pillar 2 (Retention), low-priced AI products (sub-$50/month plans) are experiencing collapsing retention, with just 32% Net Revenue Retention (NRR) and 23% Gross Revenue Retention, while enterprise-priced AI tools ($250+/month) hold a much stronger 85% NRR and 70% GRR (per ChartMogul’s “AI Churn Wave” report).
If you do not have a clear accounting structure to isolate your AI revenue and AI costs, you cannot track how your AI initiatives are influencing Pillar 3 (Gross Margins) or your overall Pillar 4 Financial Profile, where Rule of 40 medians have become harder to hit as compute costs eat into your margin.
To manage a modern software business, your financial engine must be built to handle this complexity.
Updating Your Chart of Accounts: A Step-by-Step GL Guide
Let’s get tactial. How do you set up your General Ledger (GL) to handle AI expenses?
You need to separate your AI-related activities across both your Revenue streams and your Cost of Goods Sold. Here is the blueprint to update your SaaS Chart of Accounts.
Step 1: Define Your AI Revenue Streams
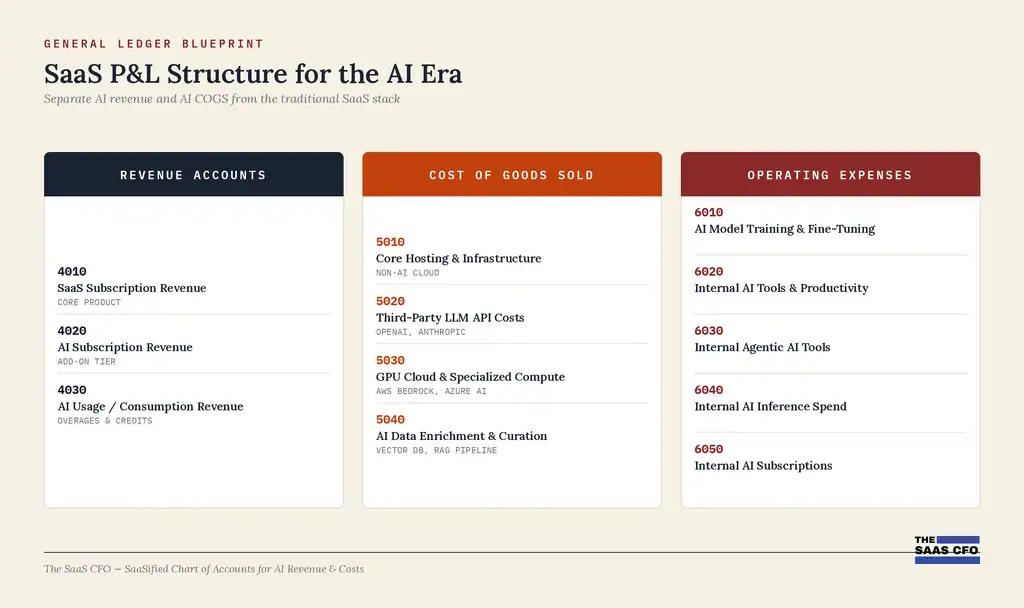
Do not dump all subscription revenue into one bucket. If you charge for separate AI functionality, create dedicated GL accounts:
- 4010 – SaaS Subscription Revenue (Core): Your base software subscription.
- 4020 – AI Subscription Revenue: The flat-fee add-on or higher-tier subscription revenue specifically tied to your AI features.
- 4030 – AI Usage/Consumption Revenue: If you bill based on tokens used, AI agents deployed, or credits consumed, track this separately. This is critical because consumption-based revenue is naturally more volatile than recurring subscriptions. Do NOT co-mingle.
Step 2: Establish Dedicated AI COGS Accounts
This is the next fork in the AI road. You must isolate your production-running AI expenses from your standard AWS hosting. Create these distinct GL accounts in your Cost of Goods Sold section under Dev Ops:
- 5010 – Core Web Hosting & Infrastructure: Your standard AWS, Azure, or GCP hosting costs for the core application (non-AI).
- 5020 – Third-Party LLM API Costs: Outgoing payments to OpenAI, Anthropic, Cohere, or other model providers that are directly consumed by your users in production.
- 5030 – GPU Cloud & Dedicated Compute: If you host open-source models (like Llama) on dedicated GPU instances (e.g., RunPod, CoreWeave, or specialized AWS/Azure GPU clusters) to serve production requests.
- 5040 – AI Data Enrichment & Vector Infrastructure: Costs for vector databases (Pinecone, Qdrant) and external data enrichment APIs that fuel your retrieval-augmented generation (RAG) pipelines.
If you want the fully expanded version of this breakdown, including AI monitoring and observability tooling and the GAAP treatment of training vs. inference costs, I go deeper on that in my earlier post on what belongs in AI COGS.
Step 3: Isolate AI OpEx from AI COGS
There is a difference between serving AI to your customers and developing or using AI internally.
Model Training vs. Inference: If you are spending $50,000 on GPUs to train or fine-tune a model, that is an R&D Expense (OpEx). And it could possibly be capitalized. It is an investment in product development. However, once that model is deployed to production and actively answering customer queries, the ongoing GPU/API cost sits in Dev Ops under COGS.
Internal Productivity Tools: Licenses for GitHub Copilot or Cursor for your engineering team, Jasper for your marketing team, or internal AI agents built to automate G&A processes belong in their respective departments. Expenses follow the people. They are not COGS because they are not required to deliver the product to the end-user.
The Pricing Dilemma: Protecting Gross Margin Against Variable Costs
Once you have your Chart of Accounts (COA) set up, the data will likely reveal an emerging truth: traditional seat-based pricing is a terrible fit for AI features.
Kyle Poyar’s Growth Unhinged research shows usage-based pricing adoption climbing from 27% in 2023 to 38% in 2026, while pure per-seat pricing (headcount as the only value metric) has collapsed to just 8% of the market. Why? Because if an AI agent can do the work of five human employees, selling software based on “employee seats” actively punishes you. You are delivering more value while shrinking your billable seat count, all while your GPU COGS climbs. Hence, the SaaSpocalypse in early 2026.
To protect your Pillar 3 Gross Margins, you must align your pricing structure with your cost structure.
In late 2026, the fastest-growing software companies are adopting hybrid pricing models, combining a stable subscription base with a usage-based or credit-based AI layer. Poyar’s own 2026 State of B2B Monetization survey backs this up: hybrid pricing rose from 25% to 37% adoption in a single year and is now the single most common pricing model among the 230+ companies he surveyed.
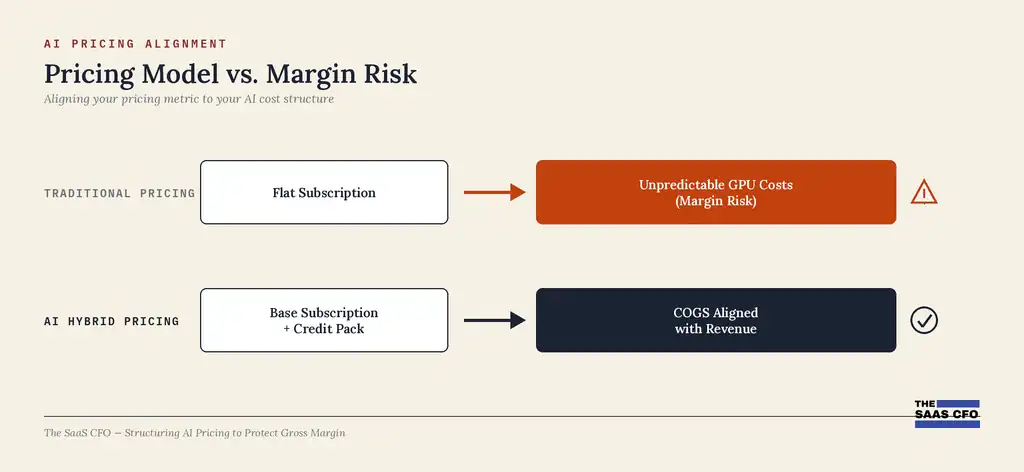
By charging for AI via credit packs or consumption limits, you ensure that as a customer’s API and compute usage scales, your revenue scales proportionally, effectively placing a floor under your gross margins.
Check out my AI metrics course for the financial plumbing you need to install.
Actionable Takeaways for SaaS Leaders
If you want to ensure your business continues to create shareholder value, execute these three steps immediately:
- Audit Your Cloud and API Invoices Tomorrow: Go through your AWS, OpenAI, and cloud hosting bills. Force your engineering and finance teams to split the invoice between standard hosting, production AI inference (COGS), internal development (R&D OpEx), and model fine-tuning/training (R&D OpEx). Check out tools such as StackPack.ai to help with this.
- Implement the “SaaSified” Chart of Accounts: Update your accounting ledger with the dedicated AI revenue and COGS accounts detailed above. Stop co-mingling AI API costs with legacy SaaS infrastructure.
- Establish an “AI Gross Margin” KPI: Track your core software gross margin (target 80%+) alongside your blended AI-inclusive gross margin (target 50% to 65%+ if AI is core to the product, higher if it’s a lighter-touch add-on or light models). This dual-metric reporting will give you and your investors clarity on your unit economics.
Master Your SaaS Financial Foundation
Structuring your general ledger is not just an administrative chore. It is a strategic weapon. If you want to dive deeper into building a world-class financial engine, setting up your SaaS P&L, and mastering the key metrics that drive valuations, join us inside The SaaS Metrics Foundation Course at The SaaS Academy.
Over 3,500+ software founders, CFOs, and finance operators have used our step-by-step frameworks to build structured SaaS financial systems and scale with complete confidence.
Learn More and Enroll in The SaaS Metrics Foundation Course Today
Sources
- 2026 Aleph x Benchmarkit SaaS & AI Performance Benchmarks (CY-2025 data, 342 companies) — benchmarkit.ai / getaleph.com
- Andreessen Horowitz, “Who Owns the Generative AI Platform?” — a16z.com
- ICONIQ, 2026 State of AI report
- The SaaS CFO, “What Should Be Included in AI COGS” — thesaascfo.com
- ChartMogul, “The SaaS Retention Report: The AI Churn Wave” — chartmogul.com
- Kyle Poyar, Growth Unhinged, “The 2026 State of B2B SaaS and AI Monetization Report” — growthunhinged.com
- High Alpha, 2024 SaaS Benchmarks Report

I have worked in finance and accounting for 25+ years. I’ve been a SaaS CFO for 9+ years and began my career in the FP&A function. I hold an active Tennessee CPA license and earned my undergraduate degree from the University of Colorado at Boulder and MBA from the University of Iowa. I offer coaching, fractional CFO services, and SaaS finance courses.