
Every board and CEO that hires a finance leader asks the same question. What is the market rate? This year we can answer that question with fresh data. The SaaS CFO partnered with Benchmarkit, DualEntry, and the FIF Collective on the 2026 Technology Finance Executive Compensation survey.
It was fielded in March and April 2026. In total, 288 finance executives took part, including 144 CFOs and 94 VP Finance and FP&A leaders.
Here are the highlights of the two roles most of you are benchmarking: the CFO and the VP of Finance. One theme runs through all of it. Title tells you less than you think. Revenue tier tells you more.
You can download the full report below.
What the Median CFO Earns
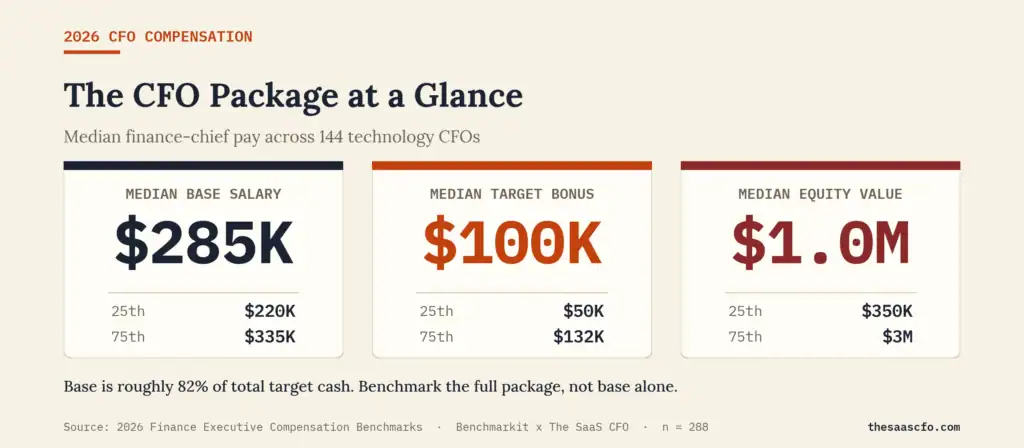
The median CFO in our survey earns a $285K base salary. The middle half of CFOs sit between $220K and $335K. Median target bonus is $100K. Median annual equity value is $1.0M.
Base salary is only part of the story. At the median, base is roughly 82% of total target cash. The rest is variable. If you benchmark a CFO on base alone, you understate the real package. Anchor on total target compensation instead.
Base CFO Pay is a Revenue-tier Story
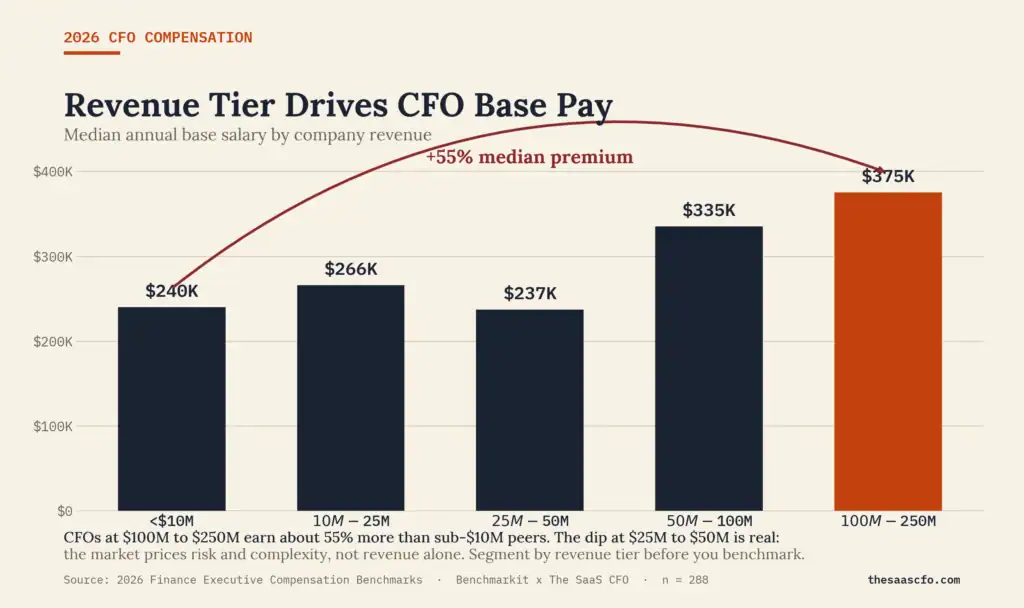
Company size drives CFO base pay more than any other single factor. CFOs at companies between $100M and $250M in revenue earn about 55% more than CFOs at companies under $10M. At $50M or more in revenue, CFO base runs $335K to $375K at the median.
One number breaks the pattern. CFOs in the $25M to $50M tier show a lower median than the tier below them. That is most likely not noise. The market is pricing risk and complexity at growth stage, not revenue alone. CFOs there often trade base for equity upside. The lesson holds either way. Segment your benchmark by revenue tier before you compare.
It’s up to you if you want to draw a trend line to smooth out the $25 to $50M tier.
The Bonus You See is Not the Bonus You Get
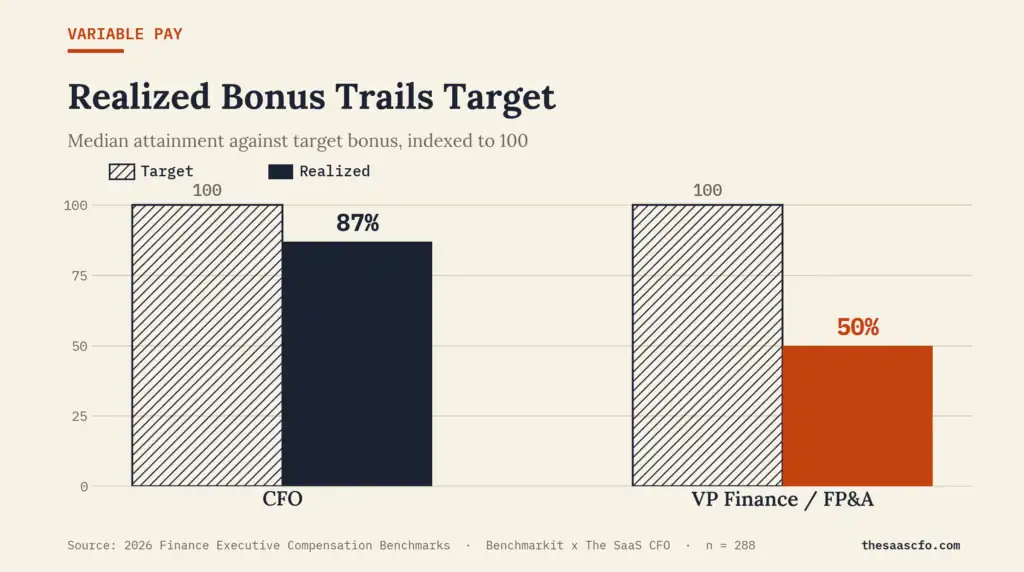
A $100K target bonus is not a $100K bonus. Median CFO bonus attainment was 87% of target. That means the typical CFO earned about $87K in variable cash against a $100K plan. For VP Finance the gap is wider. Median attainment was 50%, and more than a quarter of VPs received nothing at all.
This matters for retention. If you benchmark a finance leader against plan-level target compensation, you are comparing to a number they did not actually earn. I’d be aware of both benchmarks when setting variable compensation. It’s great to say that in theory you could earn a $100K bonus, but if that rarely gets paid, I’m going to severely discount the bonus contribution.
VP Finance: a Smaller Base, a Much Smaller Equity Grant
The median VP Finance and FP&A leader earns a $230K base. That is about a 20% discount to the CFO median. The middle half sits between $190K and $275K. Base scales with revenue here too, though the spread is tighter than at the CFO level.
Variable pay is thinner and less certain. Only 49% of VPs receive an annual bonus, and 40% have no structured bonus program at all. Median target bonus is about $35K, near 15% of base.
CFO Versus VP Finance
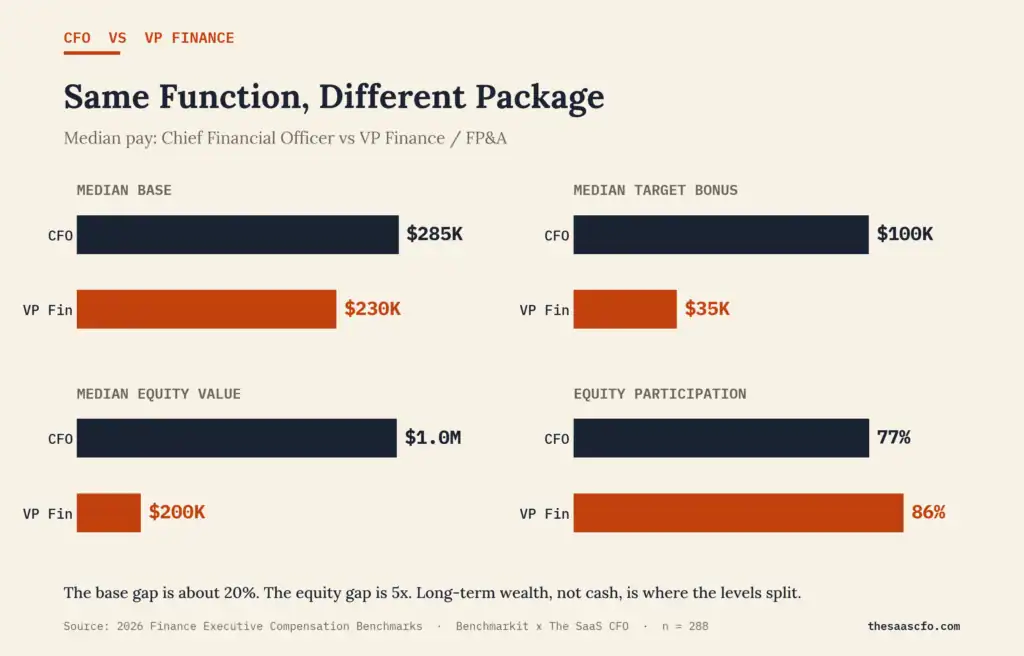
Put the two roles next to each other and the picture is clear. The base gap is about 20%. Equity participation is actually higher at the VP level, at 86% versus 77%. VPs are more likely to be offered equity. The size of the grant is where the two roles separate.
Equity is Where the Titles Really Split
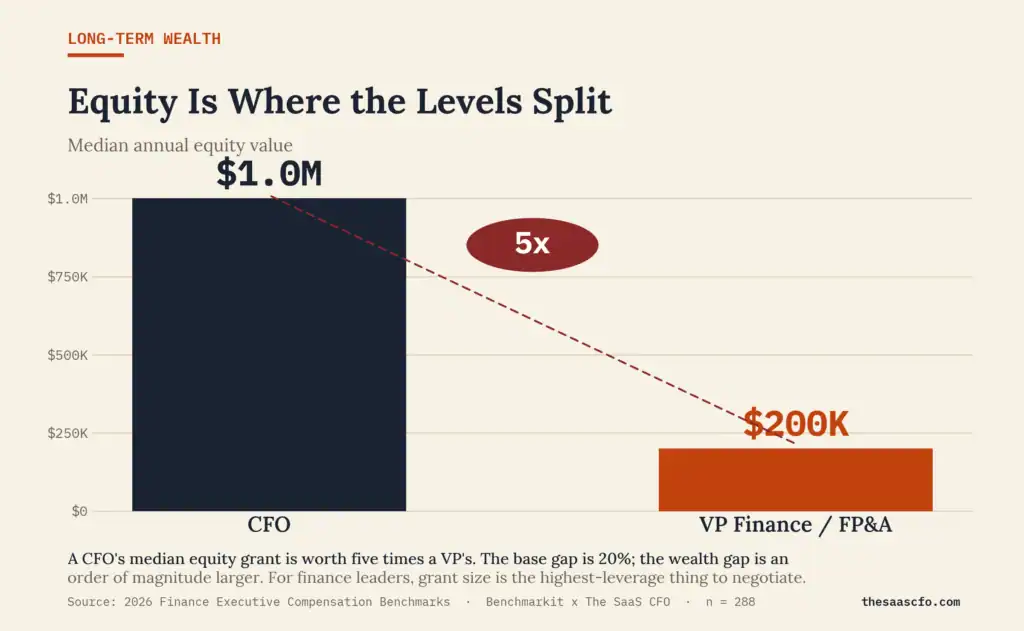
Median annual equity value is $1.0M for CFOs and $200K for VP Finance. That is a five times gap on a base gap of only 20%. For senior finance talent, long-term wealth is built through grant size, not salary.
At the CFO level, 77% receive equity, with a median grant of 1% of the pool. The standard structure is a four-year vest with a one-year cliff. If you are a finance leader negotiating an offer, grant size is the highest-leverage term on the table. A 10% change in equity value moves more dollars than a 20% change in base.
Severance Protection Falls Off a Cliff
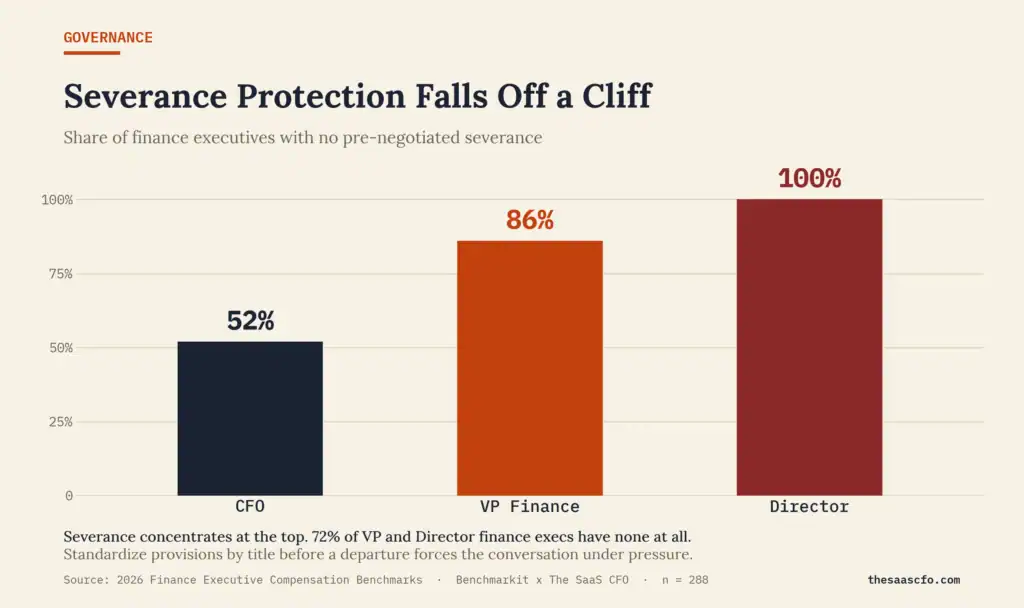
Severance is the sharpest divide in the data. 52% of CFOs have no pre-negotiated severance. At the VP level that rises to 86%, and every Director in our sample had none. Put together, 72% of VP and Director finance leaders have no severance protection at all.
This is a board issue, not an individual one. Protection concentrates at the top of the finance org, where negotiating leverage is highest and 12-month provisions are most common. Everyone below the CFO is largely exposed. Standardize severance by title or rank before a departure forces the conversation under pressure.
CFO Seats Are Filled from the Outside
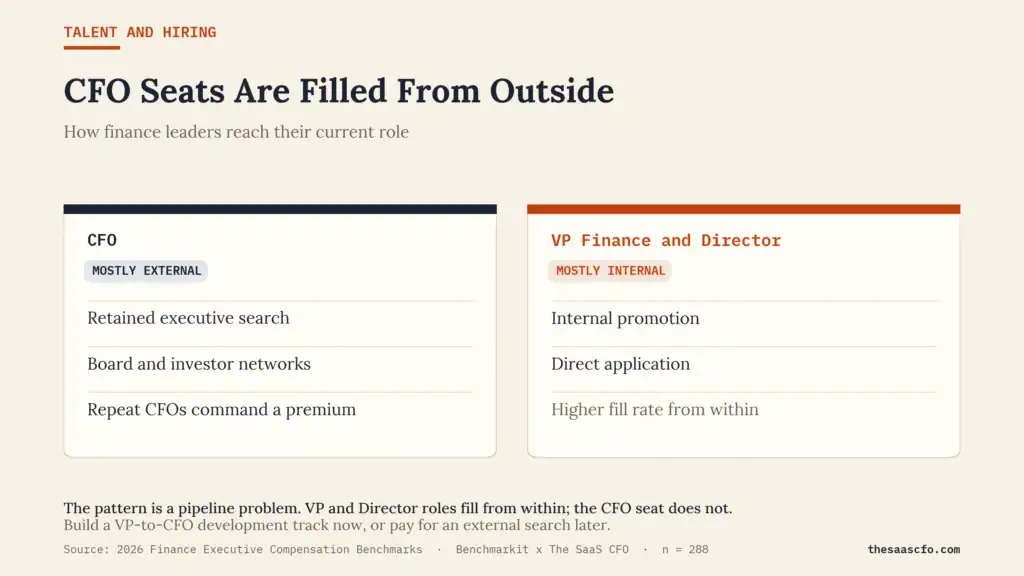
Where these leaders are sourced splits just as sharply by title. VP and Director roles fill mostly through internal promotion and direct application. CFO seats do not. They are filled primarily through retained executive search and board or investor networks and repeat CFOs who have carried the title before command a market premium.
That is a pipeline problem hiding in plain sight. If you do not build a deliberate path from VP to CFO inside your own finance org, you are committing to an expensive external search later. The candidate you develop now is almost always cheaper than the one you retain a search firm to find.
What This Means for You
For boards and hiring managers, a few habits will keep you honest. Segment by revenue tier before you benchmark. No differnet than benchmarking your SaaS metrics.
Quote total target compensation, not base alone. Measure retention risk against realized earnings, not plan targets. Standardize severance by title, so protection does not stop at the CFO. And build a VP-to-CFO development track now, because the CFO seat is the one you are least likely to fill from within. Good luck finding an experienced SaaS CFO on short notice.
For finance leaders reading your own offer, spend your negotiating energy where the dollars are. Cash matters. Equity grant size is what compounds.
About the Data
These benchmarks come from the 2026 Technology Finance Executive Compensation survey, fielded by Benchmarkit in partnership with DualEntry, The SaaS CFO and the FIF Collective. The sample is 288 finance executives, including 144 CFOs and 94 VP Finance and FP&A leaders. For the full report and more granular cuts by company size, geography, and funding source, see the complete benchmark report at the link below.
Download the full report below!
Slice and dice the benchmark data here!

I have worked in finance and accounting for 25+ years. I’ve been a SaaS CFO for 9+ years and began my career in the FP&A function. I hold an active Tennessee CPA license and earned my undergraduate degree from the University of Colorado at Boulder and MBA from the University of Iowa. I offer coaching, fractional CFO services, and SaaS finance courses.