The SaaS world already has a lot of metrics, and most companies are still working hard just to calculate the core metrics correctly.
But AI is changing the cost structure underneath SaaS unit economics. Traditional software LTV assumes that gross margin is reasonably stable across your ENTIRE customer base. That assumption breaks when customers pay the same subscription price but consume very different COGS amounts. In this case, AI compute on your AI product line.
That is where Compute-Adjusted LTV pushes itself onto your software metrics dashboard.
This new metric is meant for AI products sold under a subscription or subscription-like pricing model. Think fixed monthly plans, annual subscriptions, AI seats, AI add-ons, bundled AI tiers, or committed packages where usage can vary materially by customer.
If your AI product is priced purely on usage, you may not need this metric. In a true usage-based model, revenue should rise as usage rises. You still need to track gross margin carefully, but your focus should be usage gross margin and the inference efficiency ratio.
Compute-Adjusted LTV is for the more common and messier case: fixed or semi-fixed AI revenue with variable compute costs. Downside risk is very real.
Download the template!
The New Problem with Traditional Software LTV
Traditional LTV formula is simple.
LTV = Cohort ARPA / Revenue Churn Rate
That gross-margin-adjusted version is the one I typically recommend because it gets us closer to customer economics. We are not just asking, “How much revenue do we collect from this customer?” We are asking, “How much gross profit do we keep from this customer over time?”
LTV = Cohort ARPA x Gross Margin / Revenue Churn Rate
In traditional SaaS, this works reasonably well. Yes, we have hosting, support, customer success, and Dev Ops costs, but the cost to serve one more customer is usually not wildly different across similar customers. Therefore, we can use subscription gross margin in the LTV formula and still get a useful answer.
AI products changed this.
Every inference call, completion, workflow run, agent task, or generated output has a direct and variable cost. More importantly, that cost and usage varies by customer. Two customers can pay the same subscription price and have very different gross profit profiles.
ICONIQ Capital’s January 2026 State of AI report found that model inference averages 23% of total revenue at scaling-stage AI B2B companies.[1] It also projected average AI product gross margins of about 52% in 2026, up from 41% in 2024, but still well below traditional SaaS margin levels.[1]
That margin gap matters, but the bigger issue is customer-level usage variances.
Same Subscription Price, Different Customer Economics
Let’s say you sell a $200 per month AI workflow product.
Customer A is a power user. They run thousands of AI workflows per month and consume $110 of inference cost. Customer B is a light user and consumes $15 of inference cost. Both customers pay you $200 per month. Both count the same in the traditional LTV calculation.
However, they are not worth the same.
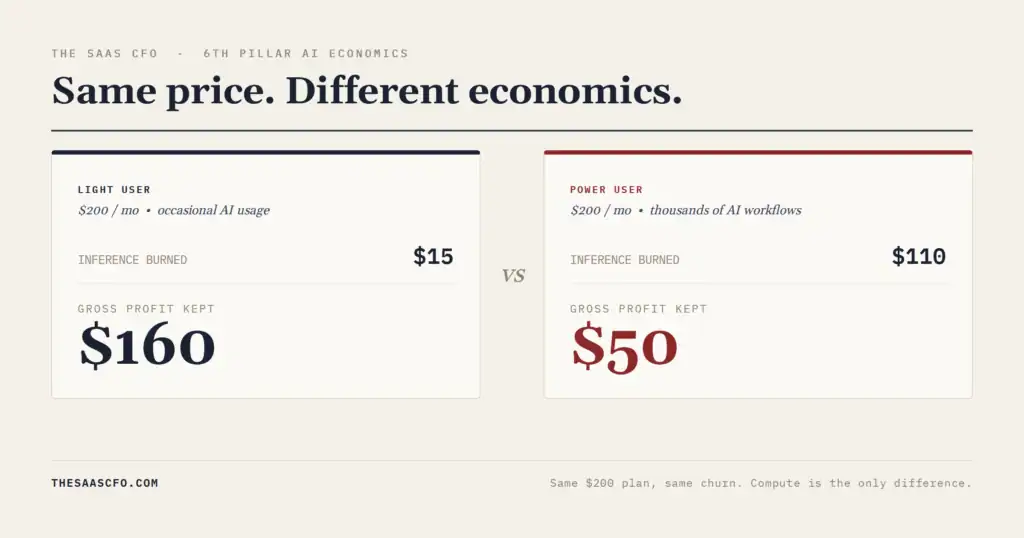
This is the key issue. High usage is not bad by default. Heavy users may be sticky, expand faster, and become your strongest product advocates. But if the pricing model does not recover your AI compute cost, high usage can quietly compress or destroy your gross margin.
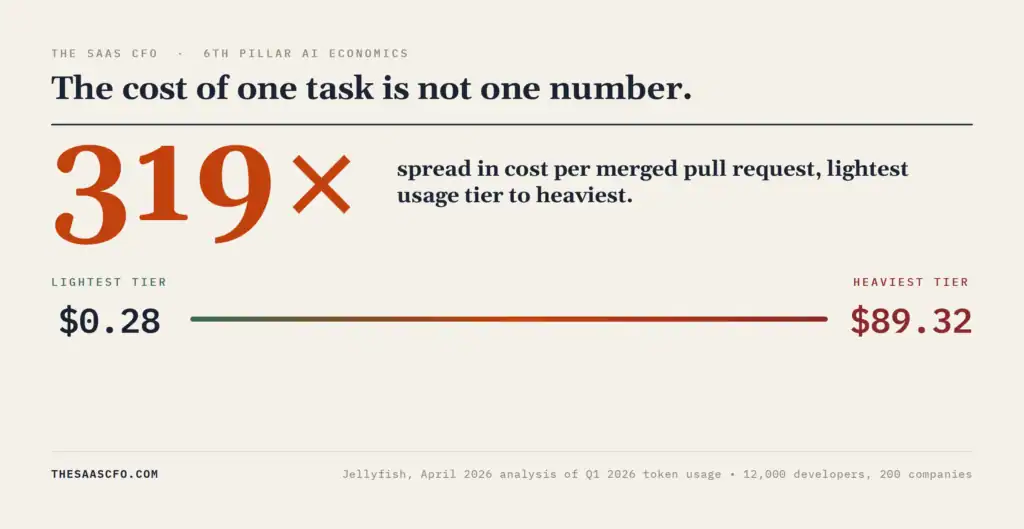
Jellyfish’s April 2026 analysis of Q1 2026 token usage across 12,000 developers and 200 companies showed how extreme this cost variance can become. Cost per merged pull request ranged from $0.28 in the lightest usage tier to $89.32 in the heaviest, a 319x spread.[2]
So, using average gross margin can be very misleading for subscription-priced AI products. The company average may look fine while one segment is highly profitable and another is barely breaking even or losing money.
What Revenue Goes into the Compute-adjusted LTV Formula?
Before we define the metric, we need to define the revenue base. “AI revenue” can mean different things.
I would separate AI revenue into three buckets.
Direct AI Revenue is the cleanest input. This includes an AI SKU, AI add-on, AI seat, AI user license, AI usage package, AI credit bundle, or AI overage revenue. The customer is paying specifically for AI functionality, so that revenue belongs in the formula.
AI-Attributed Revenue can also be included if the allocation is defensible. For example, if your standard plan is $200 per month and your AI plan is $275 per month, the $75 uplift may be treated as AI-attributed revenue if AI is the primary difference between the plans. This requires judgment, but it can work if the methodology is documented. Public tech companies are doing a great job tagging AI revenue. It’s a must in public markets.
AI-Influenced Revenue should be tracked separately. A customer may renew because of AI. A deal may close because AI helped you win competitively. An expansion may be partly driven by AI adoption. Those are important commercial signals, but they are too soft for the numerator of a unit economics formula unless you can isolate the revenue impact.
So the rule is simple: use Direct AI Revenue when available, use AI-Attributed Revenue when defensible, and track AI-Influenced Revenue separately.
The Compute-Adjusted LTV Formula
Here is the cleaner version of the metric:
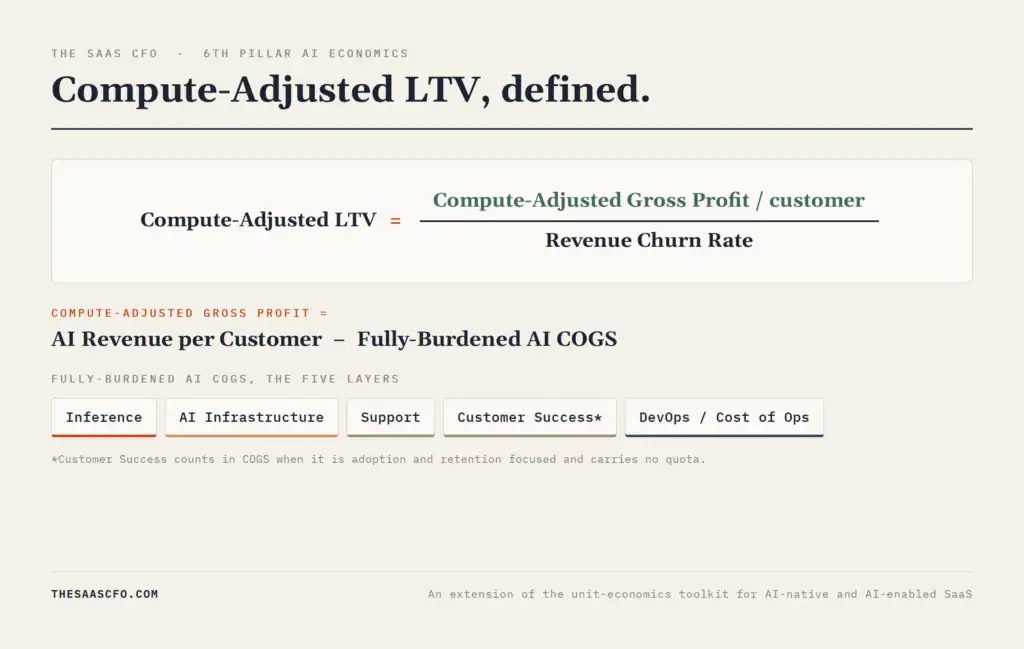
Compute-Adjusted LTV = Compute-adjusted Gross Profit per Customer / Revenue Churn Rate
Where:
Compute-adjusted Gross Profit per Customer = AI Revenue per Customer – Fully Burdened AI COGS per Customer
And:
Fully Burdened AI COGS = Inference Costs + AI Infrastructure Costs + Support Costs + Customer Success Costs* + DevOps
The phrase “Relevant AI Revenue” matters. If you are an AI-native company and the entire product is AI-powered, relevant AI revenue may simply be total customer MRR or ARR. If you sell a direct AI add-on, use the AI add-on revenue. If AI is bundled into a higher tier, use the defensible AI-attributed portion.
The cost side should be fully burdened at the gross margin level. This is not revenue less inference.
That would be too light unless you only have LLM costs to deliver your product.
Traditional SaaS LTV uses recurring gross margin. Recurring gross margin should include the costs required to deliver and support the recurring revenue stream. That typically includes support, customer success if they do not sell, and DevOps.[3]
Compute-Adjusted LTV follows the same logic. AI products simply add a new cost layer: inference and AI infrastructure. See my AI COGS post for more details.
*CS in COGS if focused on adoption and retention and they do not carry quota.
Compute-adjusted LTV Example: Acme SaaS
Let’s walk through a simple example.
Acme SaaS sells an AI-powered workflow product for $200 per month. It is sold as a subscription, not pure usage pricing. That distinction matters because customer revenue is fixed while compute consumption varies.
Acme has the following average economics:
| Input | Value |
| Monthly AI Subscription Revenue per Customer | $200 |
| Monthly Inference Costs | $55 |
| AI Infrastructure / DevOps Allocation | $11 |
| Support Costs | $12 |
| Customer Success Costs | $8 |
| Monthly Revenue Churn Rate | 2.0% |
First, calculate Compute-adjusted Gross Profit:
$200 – $55 – $11 – $12 – $8 = $114
Then calculate Compute-Adjusted LTV:
$114 / 2% = $5,700
Traditional LTV would show:
($200 – $7 – $12 – $8) / 2% = $8,650
At the company average, this looks straightforward. But the real value comes from segmenting customers by usage intensity.
Now let’s split Acme into heavy users and light users. These two tiers sit at the extremes; most customers fall between them which is why the blended average lands where it does.
Heavy users consume $110 of inference cost per month, require $15 of AI infrastructure / DevOps allocation, $15 of support cost, and $10 of customer success cost.
Their Compute-Adjusted Gross Profit is:
$200 – $110 – $15 – $15 – $10 = $50
Their Compute-Adjusted LTV is:
$50 / 2% = $2,500
Light users consume $15 of inference cost per month, require $8 of AI infrastructure / DevOps allocation, $10 of support cost, and $7 of customer success cost.
Their Compute-Adjusted Gross Profit is:
$200 – $15 – $8 – $10 – $7 = $160
Their Compute-Adjusted LTV is:
$160 / 2% = $8,000
Now assume CAC is $1,200 for both segments.
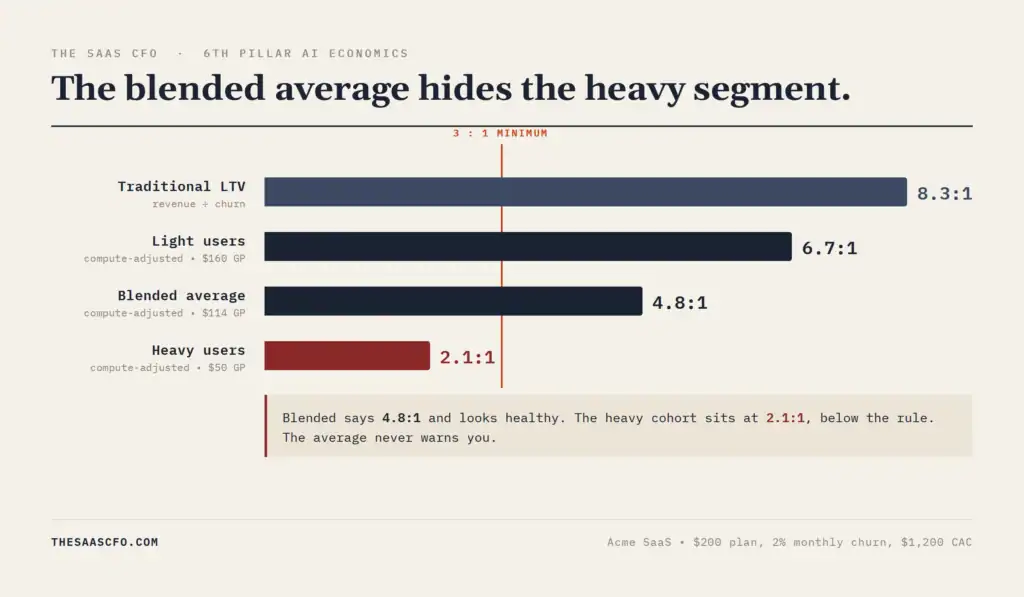
| View | LTV | LTV:CAC |
| Traditional LTV | $8,650 | 7.2x |
| Compute-Adjusted LTV, Blended Average | $5,700 | 4.8x |
| Compute-Adjusted LTV, Light Users | $8,000 | 6.7x |
| Compute-Adjusted LTV, Heavy Users | $2,500 | 2.1x |
This changes the conversation.
On a traditional basis, the customer economics look great. But once we include customer-level AI costs, heavy users are below the common 3 to 1 LTV:CAC benchmark ratio. That does not automatically mean heavy users are bad customers. It means operators need to ask better questions. And review their pricing and cost distribution ratio.
Do heavy users retain longer? Do they expand faster? Should they move to a different plan? Should there be a fair-use threshold? Should simple workflows be routed to cheaper models? Should pricing include usage credits or overages? How many heavy users do we have?
That is why this metric is useful. It does not give you the answer itself, but it points you to the right operating questions.
When to Use Compute-adjusted LTV
Use Compute-Adjusted LTV when AI is sold under a subscription or subscription-like model and compute costs vary materially by customer. It is especially useful when inference costs are more than 10% of revenue, when usage varies widely by segment, or when you are using LTV to CAC to make pricing, CAC budget, or customer acquisition decisions.
Do not overcomplicate your dashboard if inference costs are small, uniform, or immaterial. If AI compute is less than 5% of revenue and customer-level variance is low, your standard gross-margin-adjusted LTV may be enough for now.
For pure usage-priced AI products, focus elsewhere.
Hybrid models require both views. If you charge a platform subscription plus usage, use Compute-Adjusted LTV but you’ll use a formula in this usage-based LTV post.
Minimum Viable Analysis
You do not need perfect data to start. But you do need usage level data at the customer level to set up your distribution analysis. I cover this in my AI metrics course.
Customer-level is ideal, but segment-level is a good start. Begin with light users, core users, and power users. Then layer in SMB, mid-market, enterprise, plan type, and acquisition channel.
The goal is not accounting perfection on day one. The goal is to find out whether your average LTV is hiding weak customer economics. And discover what data you might be missing.
The Practical CFO Takeaway
The old SaaS playbook treated high usage as almost always good. In AI SaaS, high usage is still good if the pricing model and cost structure support it.
Software economics are evolving.
Compute-Adjusted LTV helps operators understand whether subscription-priced AI products are creating profitable customer relationships after compute and related COGS are included. It is not a replacement for CAC Payback, GRR, NRR, gross margin, or LTV to CAC. It is an extension of the unit economics for AI-native and AI-enabled SaaS companies.
If your AI costs are small, keep it simple. If your product is purely usage-priced, focus on usage gross margin. But if you have fixed AI subscription revenue and variable compute costs, you need to understand the gross profit by customer segment.
Do not panic if AI gross margins are lower than traditional SaaS margins. But do not hide from the math. The companies that understand customer-level AI economics will price better, forecast better, and scale with fewer surprises. And understand the levers to scale.
If you found this useful, subscribe to The SaaS CFO newsletter. 100K founders and finance leaders receive the weekly breakdown every Wednesday.
Sources
[1] ICONIQ Capital, “State of AI: Bi-Annual Snapshot” (January 2026). Source for model inference as a percentage of revenue and projected AI product gross margin.
[2] Jellyfish, “Is ‘tokenmaxxing’ cost effective? New data from Jellyfish explains” (April 2026; analysis of Q1 2026 token usage). Source for cost-per-merged-pull-request variance by usage tier.
[3] Ben Murray, The SaaS CFO, SaaS COGS and SaaS P&L framework. Source for recurring gross margin treatment, including support, customer success if in COGS, and DevOps.
I have worked in finance and accounting for 25+ years. I’ve been a SaaS CFO for 9+ years and began my career in the FP&A function. I hold an active Tennessee CPA license and earned my undergraduate degree from the University of Colorado at Boulder and MBA from the University of Iowa. I offer coaching, fractional CFO services, and SaaS finance courses.