Achieving Profitability in SaaS
Underneath the hood, SaaS economics can get a little tricky and nuanced. Based on the economic realities of your business, do you know how fast (or slow) you are achieving profitability in SaaS?
How fast a SaaS company can reach gross margin profitability is based on key SaaS metrics such as growth, churn, ACS (average cost of service), CAC ( customer acquisition cost), and MRR (monthly recurring revenue). Download my free Excel template below to measure your time to profit and to determine the health of your SaaS business.
The Excel template can be downloaded below.
Must Track SaaS Metrics
It is critical for your SaaS or subscription-based business to understand the balance among these key metrics. If one or many are out of balance, you may be pushing for a goal that you will never reach, run out of cash, and not understand why high customer acquisition rates are not paying off.
Wealth of SaaS Information
If you have not seen the Chaotic Flow blog by Joel York, it is well worth the visit. It is a treasure trove of SaaS metrics and the math behind those metrics. I have spent hours reading through his posts and trying to recreate some of the metrics, math, and charts that are relevant for me.
Inspired by some of Joel’s posts, I am sharing an Excel template that helps me understand the relationship of the SaaS metrics mentioned above. I incorporated this chart into my financial statement model to make sure that these key metrics align correctly, so that we are not celebrating P&L metrics that are at odds with the unit economics of the business.
Inputs
If you have the numbers below for your business, this exercise will really be impactful. Even if you don’t, you can still play around with the inputs based on assumptions for your business.
CAC, ACS, MRR, Churn, Customer Acquisition Rate
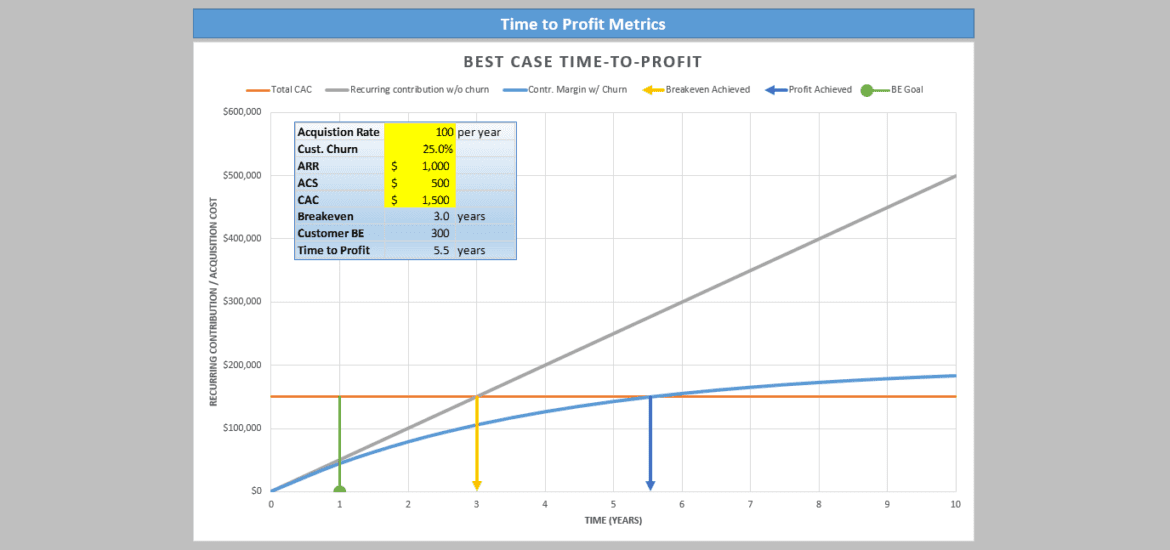
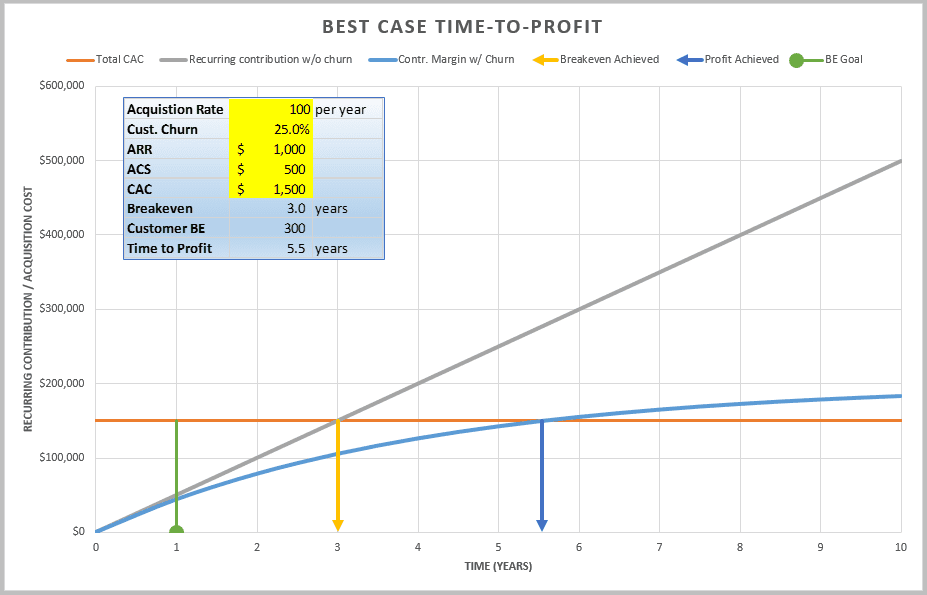
Outputs
Once you’ve completed the inputs, the graph will show you how fast or slow you break even and when you will achieve profitability (or not!).
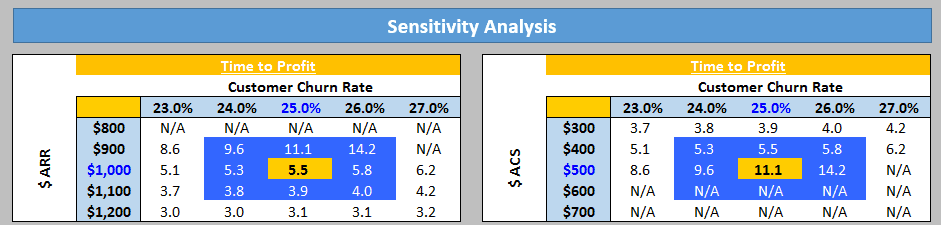
I have also included sensitivity tables, so that you see a range of outcomes without constantly changing your inputs. It is set up using Excel’s TABLE function.
Why I Love This Exercise
What I love about this template is the churn factor. Mathematically, you may reach a customer ceiling based on your customer acquisition rate and churn rate. Also, based on your churn rate, you might still be paying off customer acquisition costs for customers that are long gone.
Conclusion
In my opinion, it is very important to understand how fast you break even and how your profitability is affected by current acquisition rates and cost metrics. Your P&L and business may seem fine when you are actually just treading water or worse.
Again, I would love to hear your feedback and suggestions for improvement. Please post questions and comments below.
Download Below
Please enter your email address (no spam) below to download the model.
I have worked in finance and accounting for 25+ years. I’ve been a SaaS CFO for 8+ years and began my career in the FP&A function. I hold an active Tennessee CPA license and earned my undergraduate degree from the University of Colorado at Boulder and MBA from the University of Iowa. I offer coaching, fractional CFO services, and SaaS finance courses.
Hi, happy new year!
quick question.
If we are adding 100 customers per year at 15% churn, shouldnt we have 85 customers at the year of the year 1 instead of 93? (not sure why we are doing : 100/0.15 = Max Customers).