
If you built your SaaS finance metrics stack before 2025, your SaaS P&L is missing a line item that is quietly destroying gross margin for hundreds of companies right now.
I’m talking about inference cost (aka AI token costs). The per-token, per-call expense of running LLM-powered features inside your software product. It’s not hosting. It’s not a flat API fee. It scales directly with usage, and it behaves nothing like any cost you’ve managed before in software.
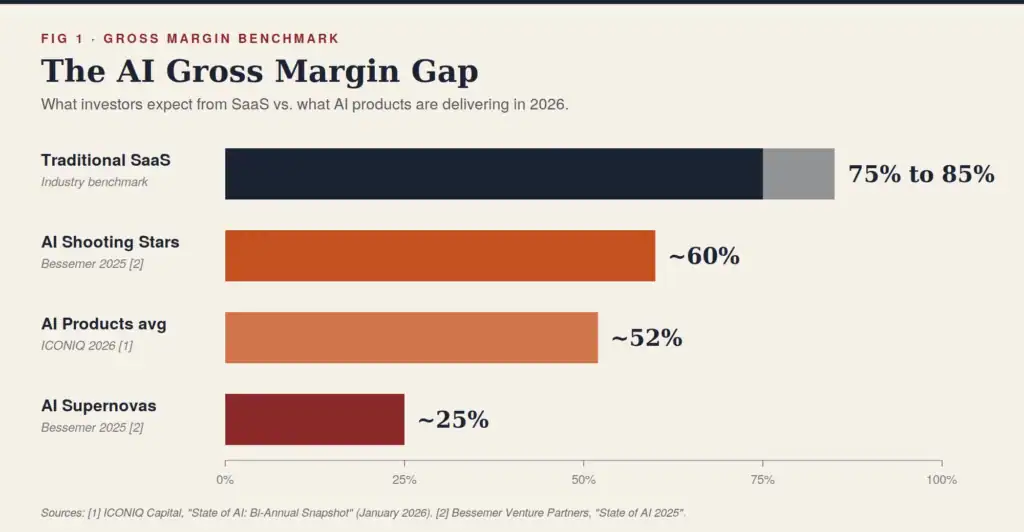
According to ICONIQ Capital’s 2026 State of AI: Bi-Annual Snapshot report, AI-native products are projected to average ~52% gross margins in 2026, compared to 75% to 85% for traditional SaaS, up from 41% in 2024 as the best operators learn to manage inference costs.[1] That’s still a 23 to 33 percentage point gap versus traditional SaaS, and inference cost is the primary culprit.
To put that margin compression in concrete terms: Bessemer Venture Partners’ State of AI 2025 report found that the fastest-scaling AI startups, those reaching $100M ARR in approximately 18 months, were averaging only ~25% gross margins, often trading profitability for distribution. Even the more durable, capital-efficient AI startups in their analysis averaged ~60% gross margins, meaningfully below the 75%+ threshold traditional SaaS investors expect.[2]
The issue isn’t that AI is expensive. Well, frontier models can be expensive. The issue is that most SaaS companies have no framework other than margin analysis for measuring whether their AI spend is efficient relative to the revenue it delivers.
Enter the Inference Efficiency Ratio into the SaaS CFO metrics stack.
What Is the Inference Efficiency Ratio?
The Inference Efficiency Ratio (IER) is a metric that I’ll add as part of the 6th Pillar of my existing 5 Pillar SaaS Metrics Framework. It measures how much revenue you’re generating for every dollar you spend on inference.
This might sound familiar to the ROSE Metric. The ROSE Metric measures the amount of recurring revenue you generate for every dollar of employee, contractor, and agentic AI spend.
The IER is distinct from your gross margin percentage. Gross margin tells you what’s left after the cost to deliver your revenue (i.e. COGS). IER is a focused efficiency signal specifically for your AI cost layer, the one that’s variable, usage-driven, and growing fastest.
Think of IER as the AI equivalent of the LTV to CAC ratio. Just as LTV to CAC tells you whether your acquisition spend is worth the effort, IER tells you whether your inference is producing revenue density.
The Inference Efficiency Ratio Formula
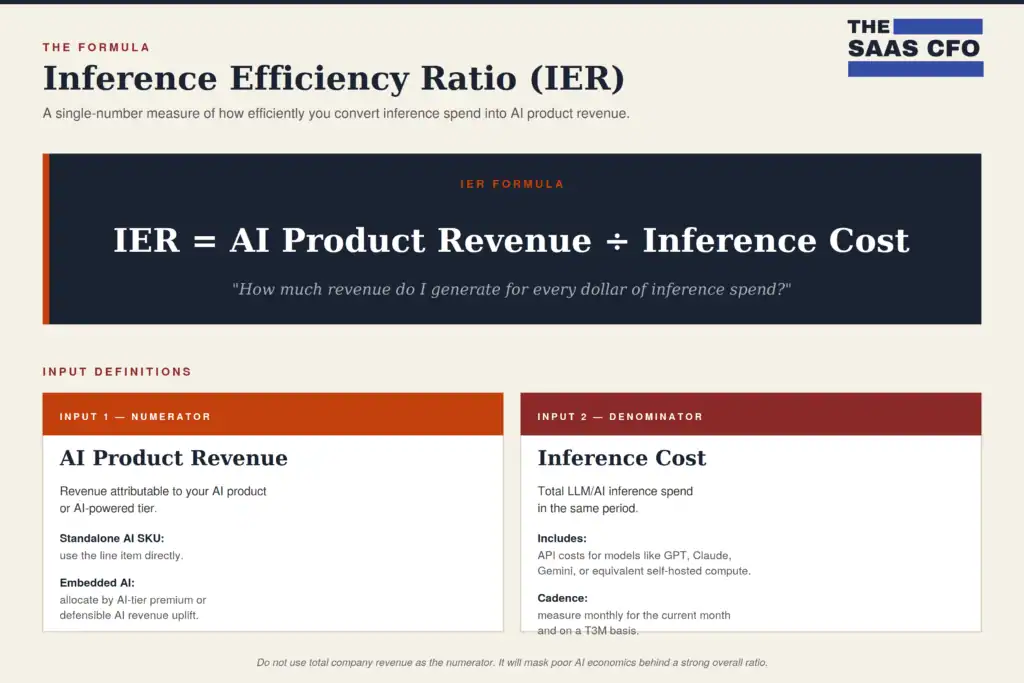
Nothing fancy here. IER = AI Product Revenue ÷ Inference Cost
That’s it. Clean and simple, and easy to calculate and benchmark.
- AI Product Revenue: Revenue attributable to your AI product or AI-powered product lines. Big spotlight here on AI ARR attribution. For companies with a standalone AI product SKU, this is straightforward. For companies with AI embedded in a broader product, this might get tricky. This highlights the importance of CFO/Product/Sales collaboration on new Product ID management. You may need to allocate based on the premium customers pay for the AI-enabled tier, or the AI-driven revenue uplift your product team can defend. Do not use total company revenue. It will mask poor AI economics behind a strong overall ratio.
- Inference Cost: Total LLM/AI inference spend in the same period. API costs for models like GPT, Claude Sonnet, Gemini, or equivalent self-hosted compute costs.
With all SaaS metrics, the period of measurement plays an important role in metric accuracy. I suggest calculating this in-month and on a trailing three month (T3M) basis. I’d also forecast this metric.
IER Benchmark Targets
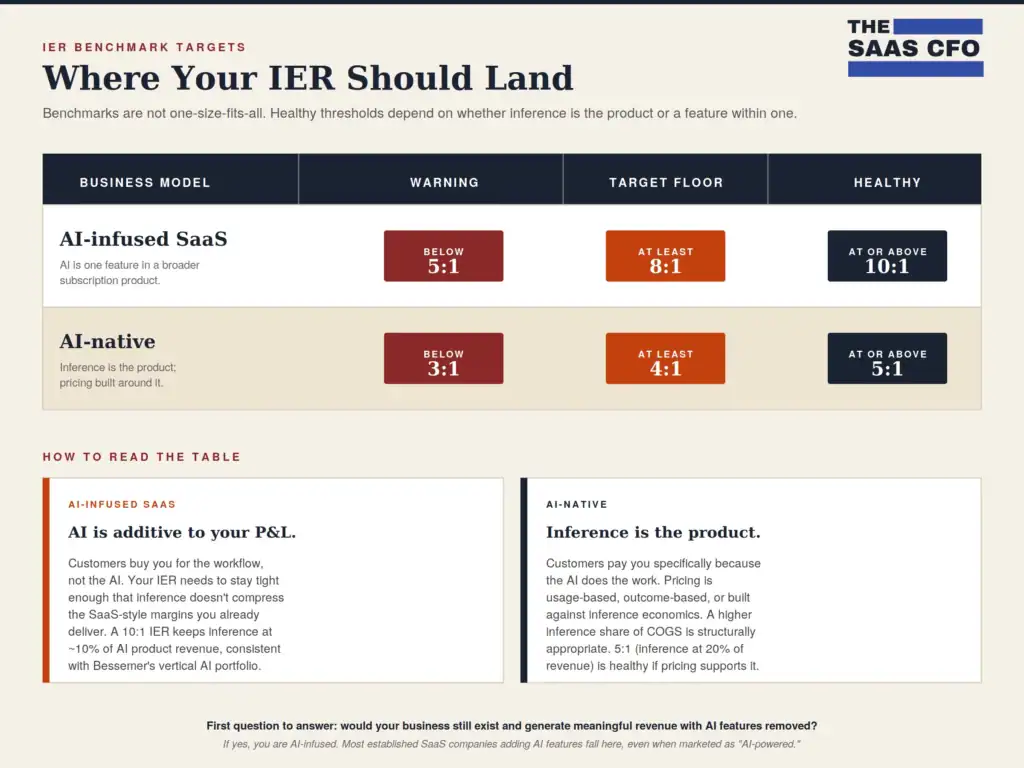
IER benchmarks are not one-size-fits-all. Your healthy zone depends on whether inference is your product or one feature inside a broader product line. Use this table as your starting point, then self-assess which row applies to your business. [4]
| Business Model | Warning | Target Floor | Healthy |
| AI-infused SaaS | Below 5:1 | 8:1 | 10:1 or higher |
| AI-native | Below 3:1 | 4:1 | 5:1 or higher |
AI-infused SaaS: AI is one feature inside a broader product. Most customers buy you for the underlying workflow, not the AI. Pricing is typically subscription or seat-based. Because AI is additive to your existing P&L, your IER needs to stay tight enough that inference doesn’t compress the gross margins your investors are already underwriting against traditional SaaS benchmarks. A 10:1 IER keeps inference at roughly 10% of AI product revenue, which is consistent with Bessemer’s vertical AI portfolio data.
AI-native: Inference is the product. Customers are paying you specifically because the AI does the work. Pricing is usage-based, outcome-based, hybrid, or a premium subscription priced against inference economics. Because inference is a core unit of value delivery, a higher inference share of COGS is structurally appropriate. A 5:1 IER (inference at 20% of AI product revenue) is healthy here, if your pricing model is designed for it.
The first question to answer before applying these benchmarks: Is your business AI-first or AI-infused? Most established SaaS companies adding AI features are AI-infused, even if they describe their product as “AI-powered.” If your business would still exist and generate meaningful revenue with the AI features removed, you are AI-infused, and the top row applies.
This is my draft of the benchmarks. With more time and more AI financial data, these my change.
Why IER Matters: What Existing SaaS Metrics Miss
Gross margin is a lagging indicator but becomes somewhat sticky for traditional SaaS companies at scale. A 5-point drop in subscription margin would be alarming if you are large.
But with a token-powered business model, it may be commonplace to see larger margin swings. Finance metrics have always been blamed as backward looking. If you price on usage or outcomes, we may finally have a reason to track AI metrics by week. IER might be a leading-edge signal.
IER isolates the variable you can control and improve in real time: how efficiently you’re deploying inference dollars to generate revenue. If inference is your product, this metric is a must-have.
There’s another reason IER matters that goes beyond your own P&L: investor scrutiny. Bessemer Venture Partners’ 2024 State of Cloud report found that their Vertical AI portfolio companies averaged ~65% gross margins, with model costs representing only ~10% of revenue. Put differently, every $1 of model spend generated roughly $6 of gross profit.[3]
As those margins compress, investors are applying increasing scrutiny to AI COGS efficiency. IER gives you a clean, defensible number to put in front of your board or investors. Just like ARPA, we want IER moving up and to the right.
An IER Example: Acme SaaS at $5M ARR
Acme SaaS is a B2B workflow automation tool. Their AI-powered Pro tier generates $5M in ARR. The AI assistant summarizes meetings, drafts follow-up emails, and answers questions against customer data. Usage has grown fast. So has the bill.
Acme is an AI-infused business. The AI assistant is the headline feature on the Pro tier, but customers are buying the broader workflow product. That means the top row of the benchmark table applies: warning below 5:1, target floor at 8:1, healthy at 10:1 or higher.
Here’s the monthly snapshot for the AI tier:
- Monthly AI Product Revenue: $417K (= $5M ARR ÷ 12)
- Monthly Inference Costs: $95K
- LLM API calls (Claude Sonnet at $3/$15 per 1M tokens): $52K
- Embedding model calls: $18K
- Vector DB and retrieval infrastructure: $15K
- Overage from power users (top 5% of accounts): $10K
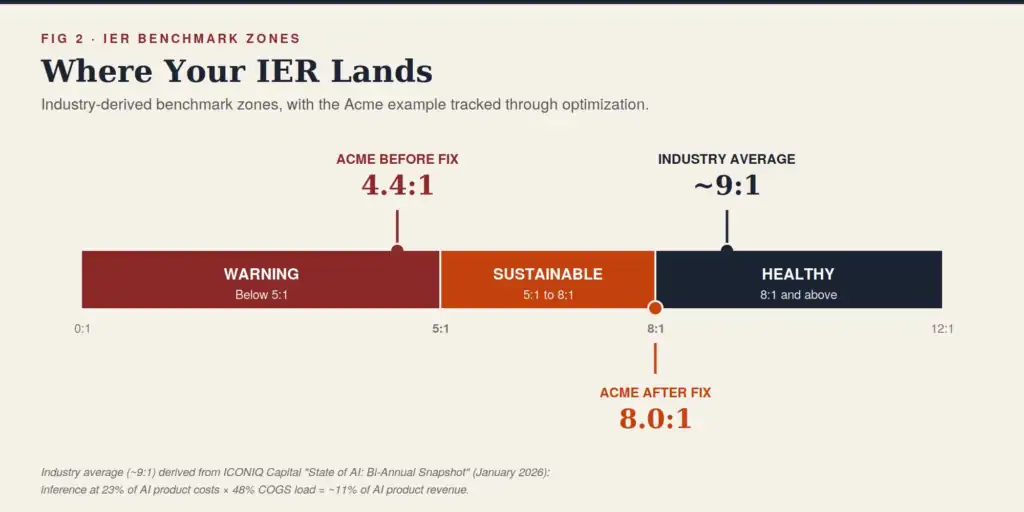
IER = $416,667 ÷ $95,000 = 4.4:1
That’s deep in warning territory. Acme is spending $1 on inference for every $4.38 of AI product revenue. Inference is eating 22.8% of AI product revenue before they pay for Dev Ops, support, and customer success. Their AI features are popular, but the unit economics are broken for an AI-infused business that needs to protect traditional SaaS-style margins.
Now the fix.
After implementing model routing (lighter Sonnet model for simple tasks, reserving Opus for complex ones, for example), prompt caching, and a usage-tiered pricing update that puts heavy users on a higher plan:
- Monthly inference costs drop to $52K
- New IER = $416,667 ÷ $52,000 = 8.0:1
Same revenue. Same product experience for most users. Acme has cleared the warning zone and hit the target floor for an AI-infused business. But they are not in the healthy zone yet. To get to 10:1, they need to keep working: tighter model selection on the long tail, more aggressive caching on repeated queries, and a closer look at the top 5% of accounts that are driving overage cost. I’m learning about saving on token spend as I build SoftwareMetrics.ai.
The lesson is not that 8:1 is the finish line. The lesson is that without IER as a measured, instrumented metric, Acme would have shipped more AI features into a 4.4:1 baseline and watched gross margin compress for another year before the board caught it.
Now, as a CFO, am I going to tell Product what model to use? No. But this is no different than me intimately understanding our Sales team’s go-to-market motions and efficiency metrics. I have to get in their business a bit to be an effective CFO.
How to Implement IER in Your SaaS P&L
The metric is simple. Getting the data right is the new homework for accounting and FP&A teams.
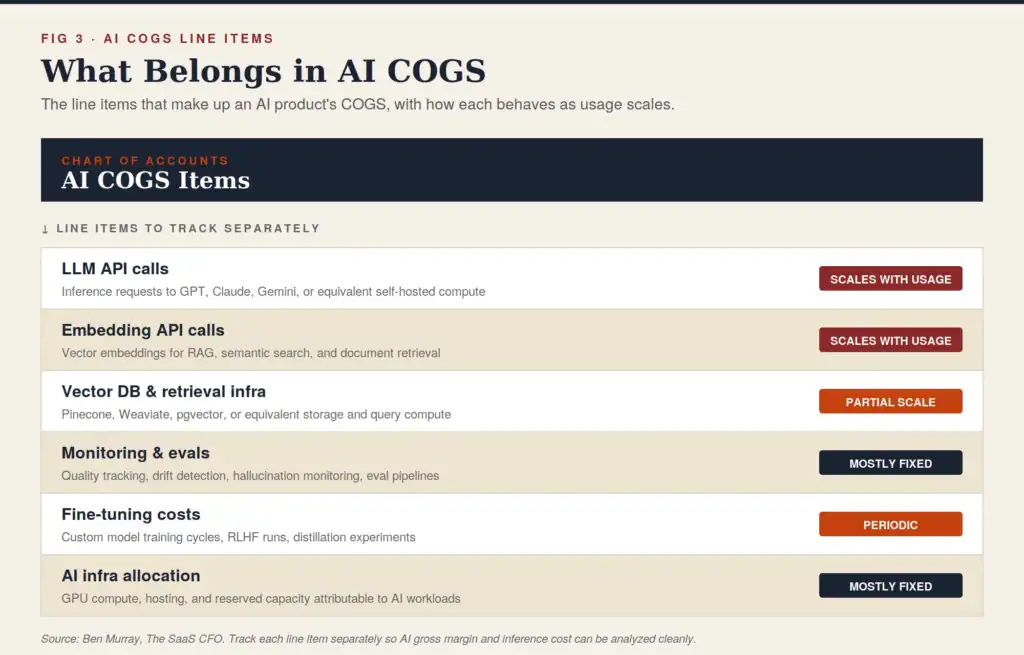
Step 1: Tag your inference spend separately in your COGS. Don’t let it blend into “infrastructure” or “third-party APIs.” See my AI COGS post for detailed tracking recommendations. Create a discrete line item: AI Inference Cost. This alone is a forcing function for clarity. I’m demanding this today from my clients.
Step 2: Instrument at the feature and customer level. Your blended inference cost tells you if you have a problem. Feature-level and customer-level cost tells is the next tracking step. Track tokens consumed (and cost) by major feature or product line or SKU, by customer tier, and by customer. To validate your hybrid pricing model, you must track usage by customer and run a distribution analysis. That’s where your biggest risk sits.
Step 3: Calculate IER monthly. Put it in your standard finance dashboard alongside gross margin, NRR, and CAC payback. Trend matters as much as the current number. Is your IER improving or declining as you ship new AI features? Be sure to forecast this metric.
Step 4: Set your IER benchmarks. Operationalize the benchmarks. Any new AI feature deployment that would push IER below 6:1, for example, needs a mitigation plan before it ships, whether that’s model substitution, usage limits, or pricing plan changes.
Common Mistakes When Tracking Inference Costs
Mistake #1: Burying inference in blended infrastructure costs. If your cloud bill rolls up into one number, you can’t measure IER. Separate it now.
Mistake #2: Ignoring the long tail. Your average inference cost looks fine. But your 95th-percentile user, the power user with massive context windows, heavy tool use, and long conversation histories, is an outlier that blows up pricing math. P50 and P95 cost profiles are both necessary. I’ve learned this the hard way building my metrics app at SoftwareMetrics.ai.
Mistake #3: Assuming costs will naturally fall. Inference pricing has been declining at the model layer, yes. But usage may be scaling faster than the drop in pricing. Agentic workflows have driven token consumption per task up dramatically since 2023, and companies that shipped more AI features have seen their costs rise even as per-token rates declined. Don’t count on market dynamics to solve your efficiency problem.
What happens to your margins and IER if token subsidization stops?
Mistake #4: Not tying inference spend to pricing. Variable costs demand variable-aware pricing. If your heaviest AI users are on the same flat subscription as your lightest users, you’re subsidizing them, and your IER reflects it. My new AI finance course dives into the structure of hybrid AI pricing models.

IER and Gross Margin: How They Connect
IER is not a replacement for gross margin analysis. It’s a companion metric that gives you earlier signal and more surgical insight. IER trends impact your gross margin trends.
Here’s the relationship:
- Gross margin tells you the outcome (what’s left after all COGS)
- IER tells you the efficiency of your fastest-growing cost driver
If your gross margin is 65% but trending down, IER tells you whether inference is the cause. If you’re optimizing IER while gross margin stays flat, you know something else in COGS is eating your margin. Maybe you added headcount, or support costs spiked.
Investors love high margin businesses so you need to know this inside and out.
The Five Pillars of SaaS Finance (Growth, Retention, Gross Margin, Financial, and Efficiency) were built for a world where COGS were largely fixed. AI changed that. The 6th Pillar, AI Economics, is about adding the metrics layer that reflects how AI costs behave: variable, usage-driven, and tied to product decisions.
IER is the anchor metric for that pillar.
Actionable Takeaways
- Add AI inference as a standalone COGS line item today. Code to Dev Ops or create a new AI cost center. If you can’t measure it separately, you can’t manage it.
- Calculate your current IER. Take your monthly AI product revenue and divide by your monthly inference spend. If you don’t have the number readily available, that’s your first problem. The attempt to calculate metrics exposes data weaknesses.
- Benchmark against the zones.
- Build tracking instrumentation at the customer and feature level, not just the blended total. Your biggest inference risks are most likely concentrated in a small number of accounts and features.
- Review pricing. If heavy AI users aren’t paying more, you’re transferring value from your P&L to them. Usage-tiered or outcome-based pricing closes that gap. See my AI finance course for more information.
- Set IER as a launch gate for new AI features. Before shipping major features, model the inference cost impact and require a plan to maintain IER above your floor. This is your margin protection plan. It’s like the old on-premise days and building business cases for major product line additions. Set IER expectations prior to launch.
Want to Go Deeper into AI Finance?
If this framing resonates, the full AI Economics framework (AI COGS waterfall, unit economics for AI-native products, investor-ready GM story) is part of my SaaS Finance course at TheSaaSAcademy.com.
Sources:
[1] ICONIQ Capital, “State of AI: Bi-Annual Snapshot” (January 2026). Survey of ~300 software executives building AI products. Supports the 52% projected AI product gross margin in 2026 (up from 41% in 2024) and the inference cost share of 20% to 23% of total AI product costs across product stages.
[2] Bessemer Venture Partners, “State of AI 2025”. Study of 20 high-growth AI startups. Supports the ~25% gross margin figure for AI Supernovas and the ~60% gross margin figure for Shooting Stars.
[3] Bessemer Venture Partners, “State of the Cloud 2024”. Supports the ~65% gross margin and ~10% model cost share for Vertical AI portfolio companies, and the ~6x ratio of gross profit to model cost.
[4] These benchmarks are calibrated against published industry data. ICONIQ’s 2026 State of AI report shows inference averaging 23% of total AI product costs at the scaling stage, alongside a projected 52% AI product gross margin.[1] Combining the two implies an industry-average IER of ~9:1 across mixed AI businesses, which is consistent with the AI-infused healthy threshold above.
[5) I first saw the IER metric in post by Monetlizey (https://www.getmonetizely.com/articles/the-economics-of-ai-first-b2b-saas-in-2026-margins-pricing-models-and-profitability). I am not sure if they coined the IER metric or someone else. I’m taking this metric concept and expanding on it.
I have worked in finance and accounting for 25+ years. I’ve been a SaaS CFO for 9+ years and began my career in the FP&A function. I hold an active Tennessee CPA license and earned my undergraduate degree from the University of Colorado at Boulder and MBA from the University of Iowa. I offer coaching, fractional CFO services, and SaaS finance courses.