Scaling a SaaS business sounds great—more logos, more revenue, better valuation. But there are three metrics that will determine if you have the potential to scale and if you are scaling versus growing.
These aren’t vanity metrics. You are swimming upstream if these metrics are not improving. Looking for a path to profitability? Start calculating these metrics today.
These SaaS metrics are part of my 5 Pillar SaaS Metrics Framework. More context, better decisions.
I will walk the through the following “Power 3” SaaS metrics.
- ROSE Metric
- Gross Profit
- Gross Revenue Retention
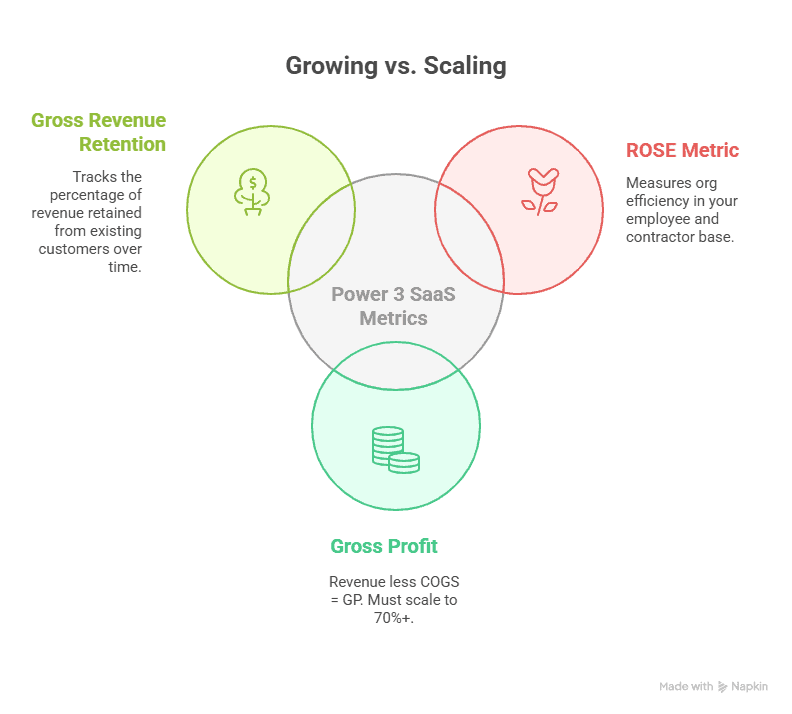
Growing vs. Scaling – You Need to Know the Difference
Every SaaS operator must understand the difference between growing and scaling. They are very different.
When you are growing, revenue and expenses are increasing, but they are increasing at the same rate. Let’s say for every dollar of incremental revenue, you must invest 75 cents. Then the next dollar of revenue costs 75 cents, and the next dollar of revenue costs 75 cents. You are growing, not scaling.
If you are scaling, that next dollar of incremental revenue costs you 74 cents, then 73 cents, then 72 cents, and so on. You are scaling. You may still be burning cash, but your org is scaling while growing.
Scaling leads to a path to profitability and a sustainable business.

The ROSE Metric: Return on SaaS Employee
I created the ROSE Metric many years ago when I noticed misleading signals from the ubiquitous Revenue per FTE metric. I do calculate Rev per FTE, but I always use it in context with the ROSE Metric.
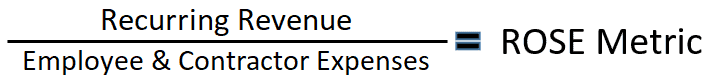
What is the ROSE Metric?
ROSE stands for Return on SaaS Employees. It measures the amount of recurring revenue we generate for every dollar of employee and contractor investment.
Who cares about how many FTEs we have. Well, we do but it tells us nothing about the investment in our employee base.
The ROSE Metric tells you immediately if you have org efficiency and if you headed in the right direction.
Why the ROSE Metric Matters
What’s the biggest investment sitting on our SaaS P&L? People! I think we’ve become “metrics blind” to overall org efficiency, because Rev per FTE has been thrown around so much.
Here’s my gut check on benchmarks after implementing this metric for many SaaS companies:
- Low ROSE = bloated org (or early stage)
- High ROSE = efficient growth
If you’re scaling headcount but not ARR, this metric will tell you fast if you are losing operational leverage.
- < $1.00: Big problem. Likely over-hired or huge early-stage investment and waiting on real revenue growth.
- $1.00 to $1.49: You are in the ballpark. This is a wide range, so be careful with trends within this bucket.
- $1.50+: You’re scaling efficiently, and it shows in positive EBITDA or net income. I typically see consistently positive EBITDA performance when companies operate above this $1.50 level.
Like this post? Subscribe to my SaaS newsletter for future updates on templates, metrics, events, and training.
How to Calculate the ROSE Metric
We need the following inputs to calculate this metric. Ideally, you’ll calculate it for the previous thirty-six months to visualize the trends. It’s also important to forecast for the next twelve months.
Revenue Inputs
- Subscription revenue
- Variable revenue if somewhat predictable and consistent
- If you have wild swings, the metric will be less meaningful. I’d suggest calculating on a trailing twelve-month basis then.
Expense Inputs
- Employee – wages, payroll taxes, benefits, bonus, and commissions
- All employees from all departments
- Contractors – all recurring full-time and part-time contractors
- Not one-time freelancers or consulting projects
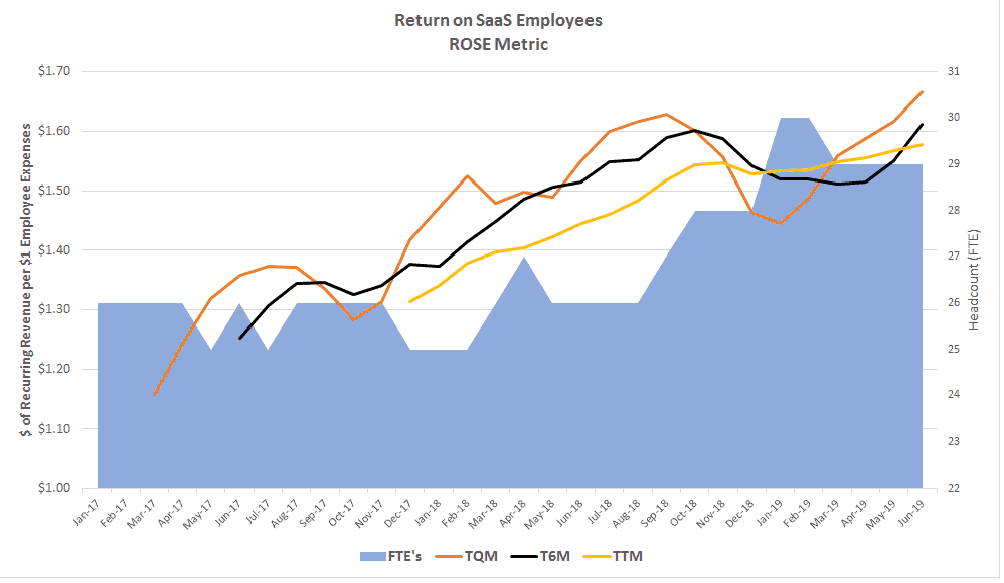
I calculate the ROSE metric on a trailing 3-month basis, 6-month basis, and 12-month basis. If your variable revenue is seasonal or unpredictable, I suggest a rolling 12-month basis.
ROSE Metric Context
Trends matter! Always calculate your ROSE historically and in the forecast for twelve months. You want to see this moving up and to the right depending on where you stand. Of course, it will top out but if you are below $1.50, you want to see upward movement.
Check out my detailed ROSE metric template and post here.
SaaS Gross Margin
Gross margin is what makes a SaaS company a SaaS company. Operators and investors love high gross profit margin percentages.
Best-in-class is 80%, but there’s a lot of noise around where AI-first margins are headed. In a conversation at SaaStock USA, an AI-first founder said his investors were pushing for margins of 80%.
I’ve helped a lot of SaaS companies and low gross profit margins are a huge hurdle to overcome if you are burning cash. If you are running in the 50s or less, you’ve got to scale them up.
What is Gross Margin?
Gross margin is revenue less COGS, or cost of goods sold. See this post on what should be included in your SaaS COGS.
You MUST code your COGS and OpEx expenses accurately. This is one of my top coaching calls with founders and finance teams.
Gross Margin = (Revenue – COGS) ÷ Revenue
Why Gross Profit Matters
High gross profit margins help cash flow and your CAC Payback Period. The more margin, the more you can invest in R&D, sales, marketing, and G&A without breaking the bank.
I usually see high gross profit margins in early-stage SaaS. As you grow, you invest and margin decline. This is the critical period. Now, you have to slowly scale your GP% to 80%.
Margins by revenue stream are also very important. Check this post on calculating margins by revenue stream.
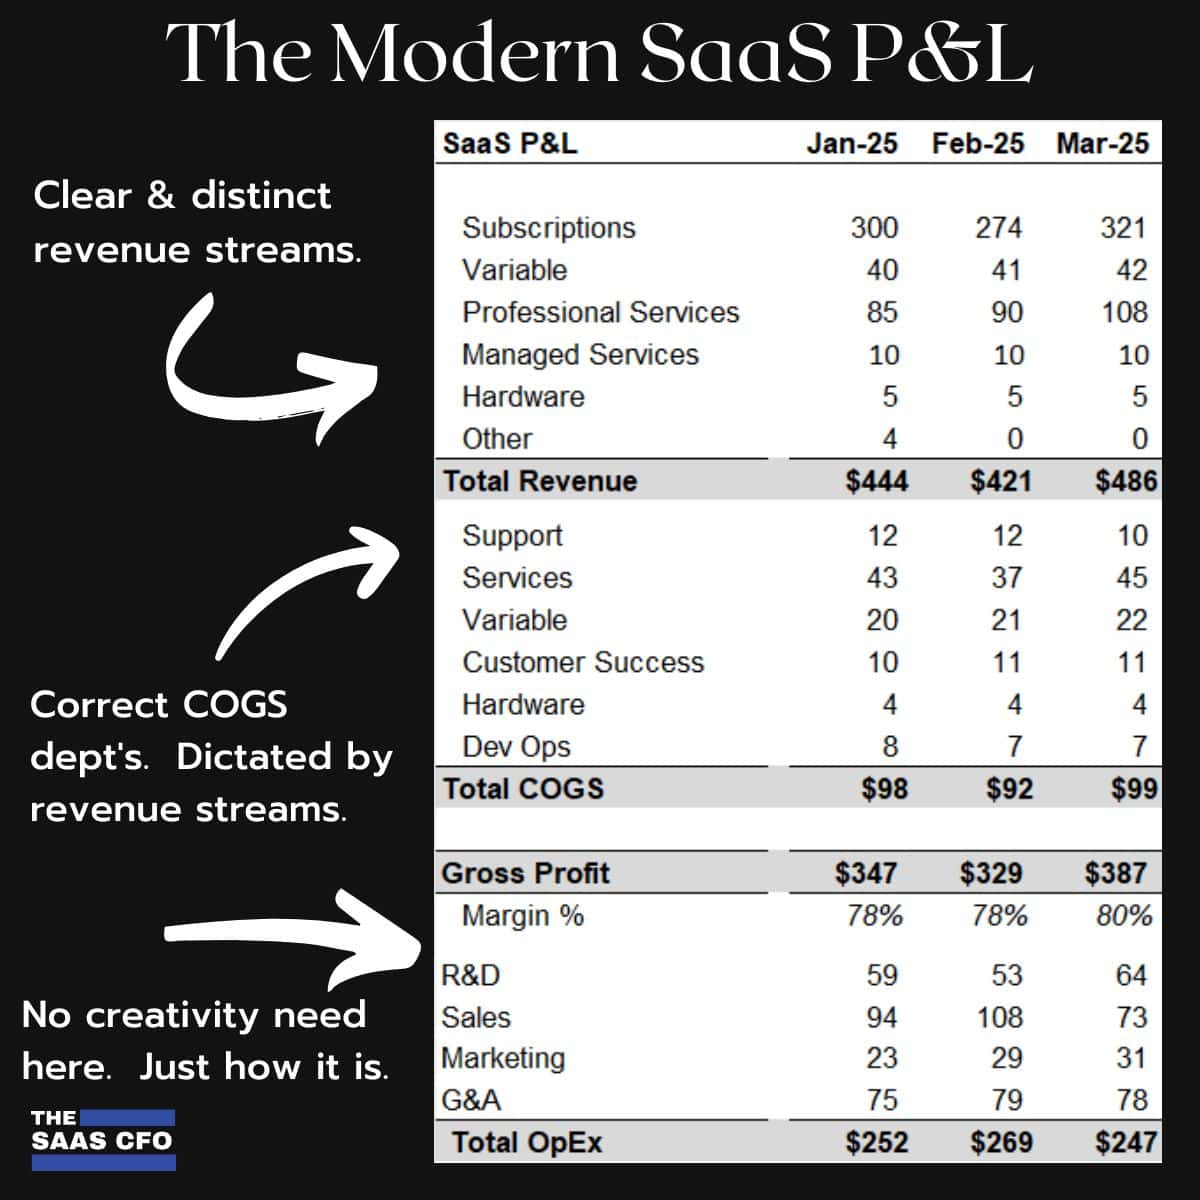
How to Calculate Gross Profit
With a properly formatted SaaS P&L, calculating your overall gross profit percentage and margins by revenue stream are a slam dunk. With the P&L below, it’s a simple exercise.
Check out my detailed post on gross profit here.
Gross Revenue Retention (GRR)
Gross revenue retention is always a north star metric in SaaS. If I was on a deserted island and could only choose GRR or NRR, I’d go with GRR.
What is GRR?
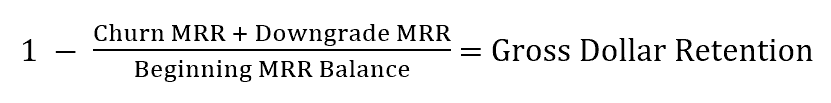
Gross revenue retention tells you how much recurring revenue that you keep from your existing customer base. It factors in only contraction and churn. It excludes expansion and revenue from new customers. GRR maxes out at 100%.
Why GRR Matters
You can’t scale if you’re constantly replacing lost revenue. It’s called the “leaky bucket” in SaaS speak. The benchmark data also proves that it’s more cost-effective to expand your existing customer base than to acquire new customers.
It’s very hard to produce a financial profile that investors will love with low GRR. This is the difference between growing and scaling.
Generally, if you offer mid to high ACV products, best-in-class GRR is 95%. If you are B2C or lower price point B2B, being in the 80s is often good.
How to Calculate Your GRR
You can calculate GRR on an aggregate revenue basis and a cohort-basis. I always calculate aggregately and then determine if cohort analysis makes sense.
If you are a low price point, high volume business, then cohort retention makes sense. For mid-market, it can also make sense. If you only acquire 1 or 2 enterprise customers per month, cohorts are less valid.
Example calculation below. I suggest downloading my retention from my GRR post to get started fast.
You should be calculating this monthly and watching trends.
Be careful with how you annualize your retention. Most companies do this wrong. For my template and more detail, check out my gross revenue retention post here.
Final Thoughts
If you’re serious about scaling, these three metrics need to be clean and tracked monthly:
- The ROSE Metric tells you if your team size is justified.
- High gross Margin funds your growth.
- GRR tells you if your product is sticky and/or if you are acquiring the right customers.
Action Items
- Review your SaaS P&L. Can you calculate your overall GP%?
- Audit your headcount and COGS setup.
- Make sure you can isolate ALL of your employee and contractor expenses
- Calculate your MRR schedule with is the basis for your revenue retention calculations.
- Build a monthly dashboard for all 3 metrics.
Don’t just focus on top-line ARR growth. The Power 3 metrics show if you’re actively building a business to scale.
I have worked in finance and accounting for 25+ years. I’ve been a SaaS CFO for 9+ years and began my career in the FP&A function. I hold an active Tennessee CPA license and earned my undergraduate degree from the University of Colorado at Boulder and MBA from the University of Iowa. I offer coaching, fractional CFO services, and SaaS finance courses.