
Financial discipline never goes out of style. CFO’s have a good laugh when the market and pundits start calling for financial awareness. When times are good, let’s grow as fast as possible and burn a ton of cash. However, when market sentiment turns negative, let’s control spend and assess our cash runway.
Harder economic times forces the acceleration of our financial maturity. There are calls to calculate and extend our cash runway. Understanding your number of months of cash is great. Now what? What steps do you take next to persevere cash?
Harder economic times and uncertainty force the acceleration of our financial maturity.
Your cash balance is the end result of the decisions that you make everyday in your business. You have to go upstream from cash to impact your cash balance.
If you are in cash burn mode, founders and management teams must understand their path to profitability. When growth slows, we must understand the levers to pull to change our financial profile.
Learn how to apply my 5 Pillar SaaS Metrics Framework here!
In this post, I’ll introduce my five-pillar financial framework. This framework acts as my roadmap to financial transparency and better decision making. To accelerate our financial maturity, we must move from left to right in this framework.
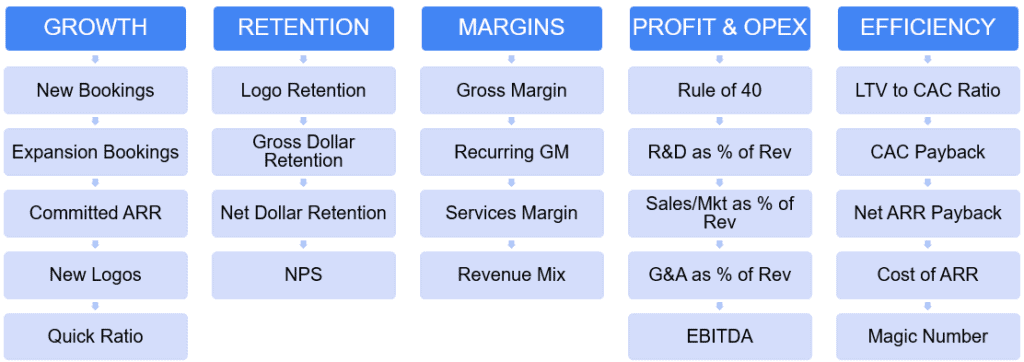
Growth
Growth is multi-faced in a SaaS business. We must understand the “layers” of our revenue. There are four layers to our recurring revenue. It includes new, expansion, contraction, and churn.
They key is understanding the movement within these layers. What drives our growth? How does contraction and churn slow our growth? Are we better at new business acquisition or expanding our existing customer based?
Documenting these layers in our monthly reporting process allows us to understand positive or dangerous trends. We can then focus on areas that need our attention.
Our growth engine is our cash engine. We must understand the movement within our recurring revenue.
Our sales motion dictates how we track the layers of revenue. If we have “closed won” opportunity sales process, we track new, expansion, and contraction via our bookings report from our CRM software.
If customers sign up and pay directly on your site, you track these layers via your payment or invoicing software such as Stripe. You may also have a mix of both sales motions which is quite common.
The result is the same. We understand the health of our growth engine. And our growth engine is our cash generation engine.
Retention
Retention has become a popular SaaS valuation metric for good reason. Great retention provides cash flow stability. It also drives efficient revenue growth which further enhances our cash flow.
Remember, retention focuses just on our existing customer base which is why it is so powerful. We do not need new customers to drive growth or add to our cash balance.
There is a lot of conceptual overlap between tracking our growth profile and our retention profile. With retention, we are focused on three of the four layers of recurring revenue. The focus is on expansion, contraction, and churn. We do not factor in the “new” layer when calculating retention.
Great gross dollar retention (GDR) provides us peace mind via predictable cash flows. Great net dollar retention (NDR) provides efficient expansion, a great use of capital, and revenue growth.
Margins
Understanding your gross margin profile is good, fundamental financial management. We must not only understand our overall gross margin but also our margins by revenue stream.
If you have several revenue types, it’s a “must” to calculate your margins by revenue stream. Very different stories can be told by each revenue stream. If your overall gross margin is low, that’s less cash to cover OpEx and less cash dropping to your bottom line.
The proper SaaS P&L setup is key to the margin calculation process. If your cost of goods sold (COGS) are lumped together or poorly coded, it’s almost impossible to pinpoint inefficiencies in the delivery of your revenue streams.
If cash is tight or your future is uncertain, it’s very difficult to know where to focus your energies on improvement. It’s very difficult to improve your cash position with low gross margins.
Financial Profile
How about that? When times are time tight, the Rule of 40 is back in style. There are lovers and haters of this financial metric, but investors aside, the Rule of 40 adds financial discipline to your decision-making process.
Whenever you invest in your P&L, ask yourself these questions. Will this investment improve efficiency and cash flows in the long run? Or will it burn cash in the short term but drive top-line growth? Both are desired results, but you must understand if your goal is growth or profit. Both are difficult at the same time (shout out to the PE world with that one!).
The Rule of 40 is a great internal metric. It adds financial discipline to you decision-making process.
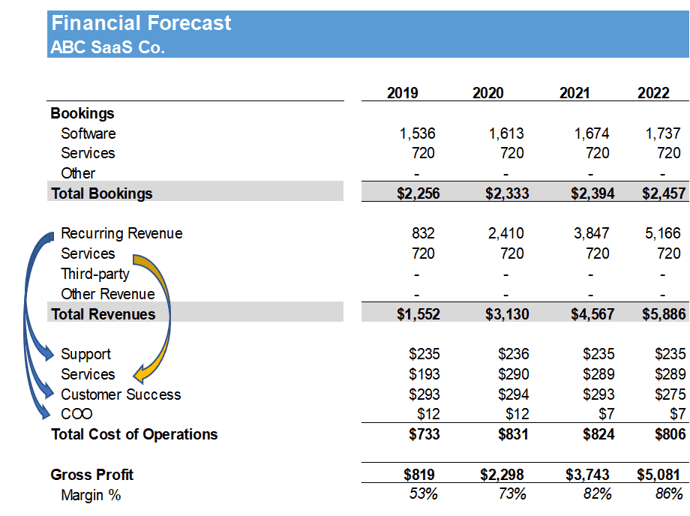
The “bottom half” of our SaaS P&L includes our operating expenses. Our OpEx departments include R&D, Sales, Marketing, and G&A.

To size your investments in these departments, you can calculate the department expense as a percent of total revenue. I profile HubSpot a lot in my SaaS metrics course. In the chart below, you can see how their spend in OpEx became more efficient over time.
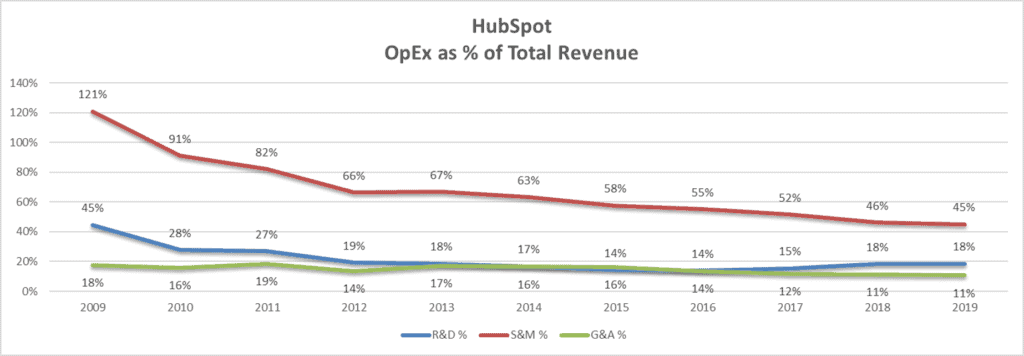
When you are looking at sales and marketing, however, I rely on sales and marketing efficiency metrics. The percent of spend does not tell me if my go-to-market engine is efficient or not.
Efficiency
A lot of investment is poured into sales and marketing. It’s no surprise that we calculate quite a few sales and marketing efficiency metrics. But we can’t forget about overall organizational efficiency in the form of revenue per FTE and the Rose Metric (more accurate than revenue per FTE).
I cover sales and marketing efficiency metrics in detail in other blog posts. You can click on the links below to learn more.
- Customer Acquisition Costs (CAC)
- CAC Payback Period
- Cost of ARR (SaaS CAC Ratio)
- LTV to CAC
- Net ARR Payback Period
If cash is tight or you need to slow down spend, you must understand your CAC profile. Otherwise, you don’t know if you should continue to invest or pull back.
Of course, if you are early stage, you may not have great CAC data yet. In this case, you need to put my framework in place so that you can see a cause and effect relationship with your spend.
Accelerate Your Financial Maturity
With investors and Boards asking us to allocate capital more efficiently, you need a financial framework in place. If you do not know what is working and what is not working in your financial profile, it will be very hard to allocate cash and manage your cash runway.
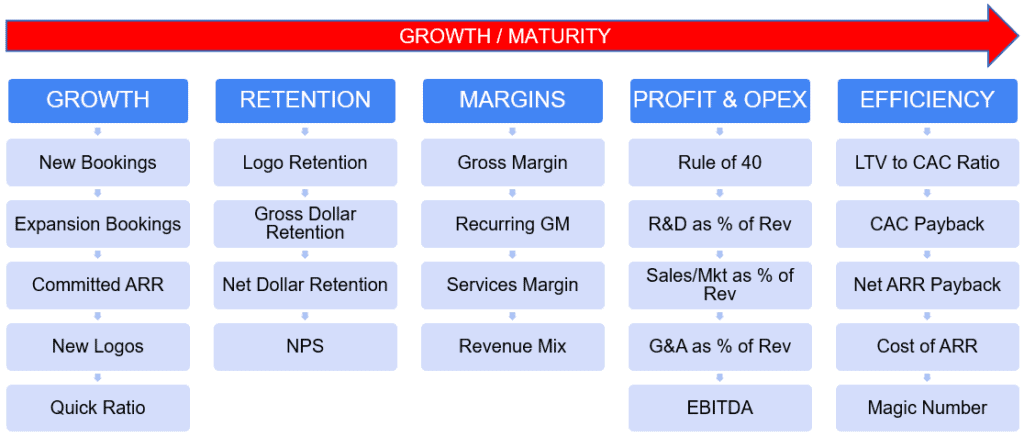
Use my five-pillar metrics framework as a roadmap. Your financial maturity increases when you move from left to right in the framework. Start with the first pillar, calculate those metrics. Move on to the second pillar and so on.
Accelerate your financial maturity by moving from left to right in the five pillar SaaS metrics framework.
If you are a mature SaaS company, you should have my entire framework calculated for historical and forecasted periods. And then you should be calculating your metrics by major customers segments (i.e SMB vs Enterprise).
If you are early-stage SaaS, it will be a painful process moving from left to right. It does not happen overnight. But start tracking the data now. It’s very hard to backtrack.
Download my five pillar framework below.
I have worked in finance and accounting for 25+ years. I’ve been a SaaS CFO for 8+ years and began my career in the FP&A function. I hold an active Tennessee CPA license and earned my undergraduate degree from the University of Colorado at Boulder and MBA from the University of Iowa. I offer coaching, fractional CFO services, and SaaS finance courses.
Highlighted this for future reference.
Did you have any recommendations on early stage SaaS and apps to track these 5 pillars, other than collecting Stripe data?
Hi Benjamin,
Yes, I created a SaaS metrics dashboard app. I’ll email you with the details.
Ben