SaaS Revenue Waterfall Chart
Ugh, Budget Season!
For most of us, we are beginning budget season or we are in the midst of budget season spending crazy hours manipulating numbers, building models, and meeting with department heads to create a workable first draft of the budget.
I won’t dive into the pro’s and con’s of budget seasons like this, but whether you are building next year’s budget or forecasting the next twelve months, you will need to explain the year-over-year variances in your recurring revenue forecast.
Download the Excel Model Below
It doesn’t matter if you are budgeting in Excel or using the latest online budgeting/CPM software, you always have to explain your variances, whether year-over-year or forecast-over-forecast. I believe one of the best ways to visually explain your revenue forecast is with a SaaS revenue waterfall chart.
Double Check Your Numbers
Also, as you explain the variances, you can catch any modeling or assumption errors if the numbers or explanations just don’t make sense. It’s a great way to audit your numbers.
As I was building my recurring revenue waterfall chart for a Board presentation, I was wishing that I had an automated way to create this chart without manually calculating all of the revenue changes that comprise the YOY revenue change.
Automated Charts?
I had already released an ARR and MRR revenue forecast model, so I thought I would try some formula magic to create an automated waterfall chart. As your revenue forecast changes, so does the chart. Done!
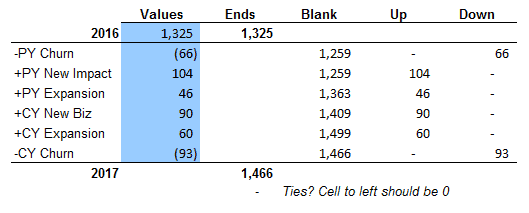
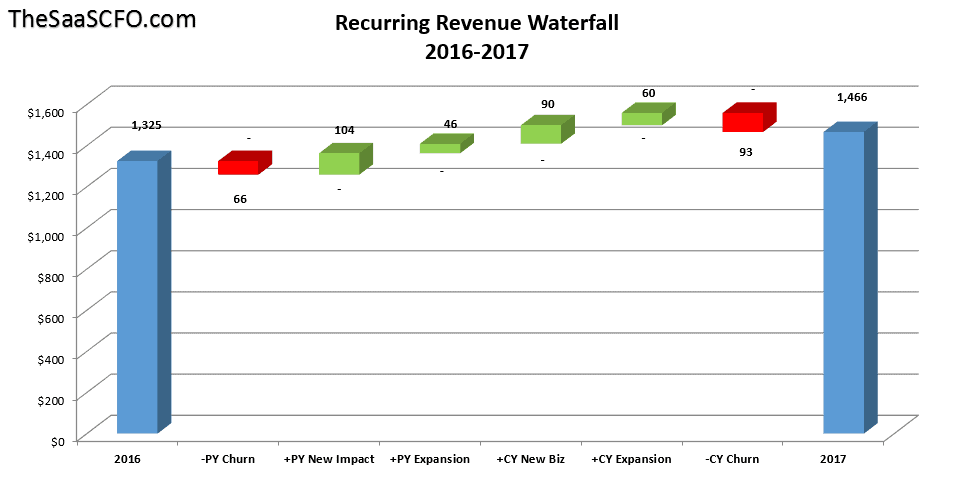
If you can believe it, to fully explain the YOY variances in a SaaS revenue forecast, you need to calculate six, yes six, different ARR movements at a minimum. I say at a minimum because you could have mid-year pricing changes, product changes, etc. that could move your forecast one way or the other.
Prior Year or Base Year
-Prior Year Churn
+ Prior Year New
+ Prior Year Expansion
+Current Year New Biz
+Current Year Expansion
-Current Year Churn
=Current Year or Forecasted Year
Why all the Movement?
Why prior year? Because you haven’t realized the full-year impact of that churn, new booking or expansion until the following year. For example, if you book a new deal in April of the base year and recognize 9/12 of that revenue, you still have 3/12 of a revenue increase in the following year, because you will now have 12 months of that revenue in the forecasted year. That causes a YOY variance for the good as an example.
Power of a Picture
If you have seasonal bookings or bookings heavily weighted in one quarter or the other, a waterfall chart is a powerful way to explain your forecast. With SaaS revenue, what people don’t realize is that it is not just growth in the forecasted or budgeted year driving your YOY changes, it’s also what happened in the prior year that still has to play out.
Below you can download my enhanced ARR revenue forecast model with automated waterfall charts for two periods. In this case, 2016-17 and 2017-18. Of course, you can change the years to your liking and also apply this same logic to the MRR revenue forecast model.
Please enter your valid email below (no spam) for the instant download.
If you do not receive the download, please contact me.
I have worked in finance and accounting for 25+ years. I’ve been a SaaS CFO for 8+ years and began my career in the FP&A function. I hold an active Tennessee CPA license and earned my undergraduate degree from the University of Colorado at Boulder and MBA from the University of Iowa. I offer coaching, fractional CFO services, and SaaS finance courses.