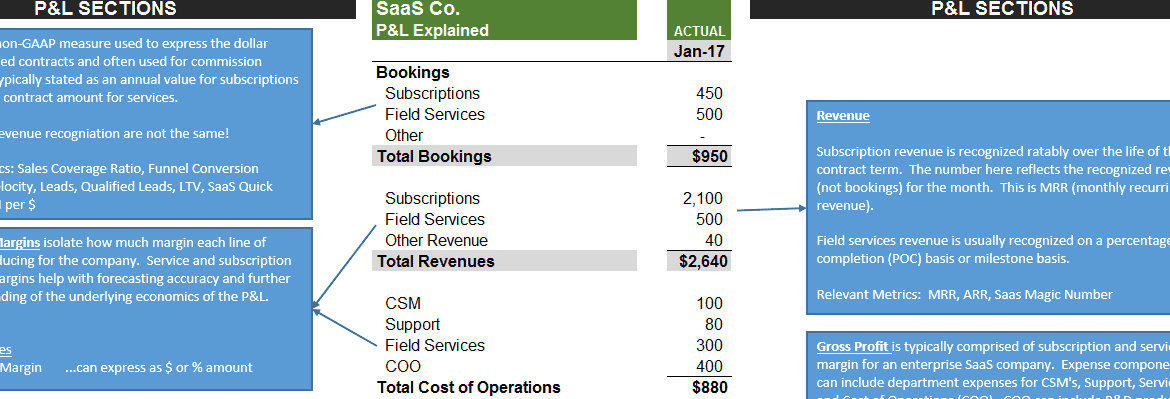
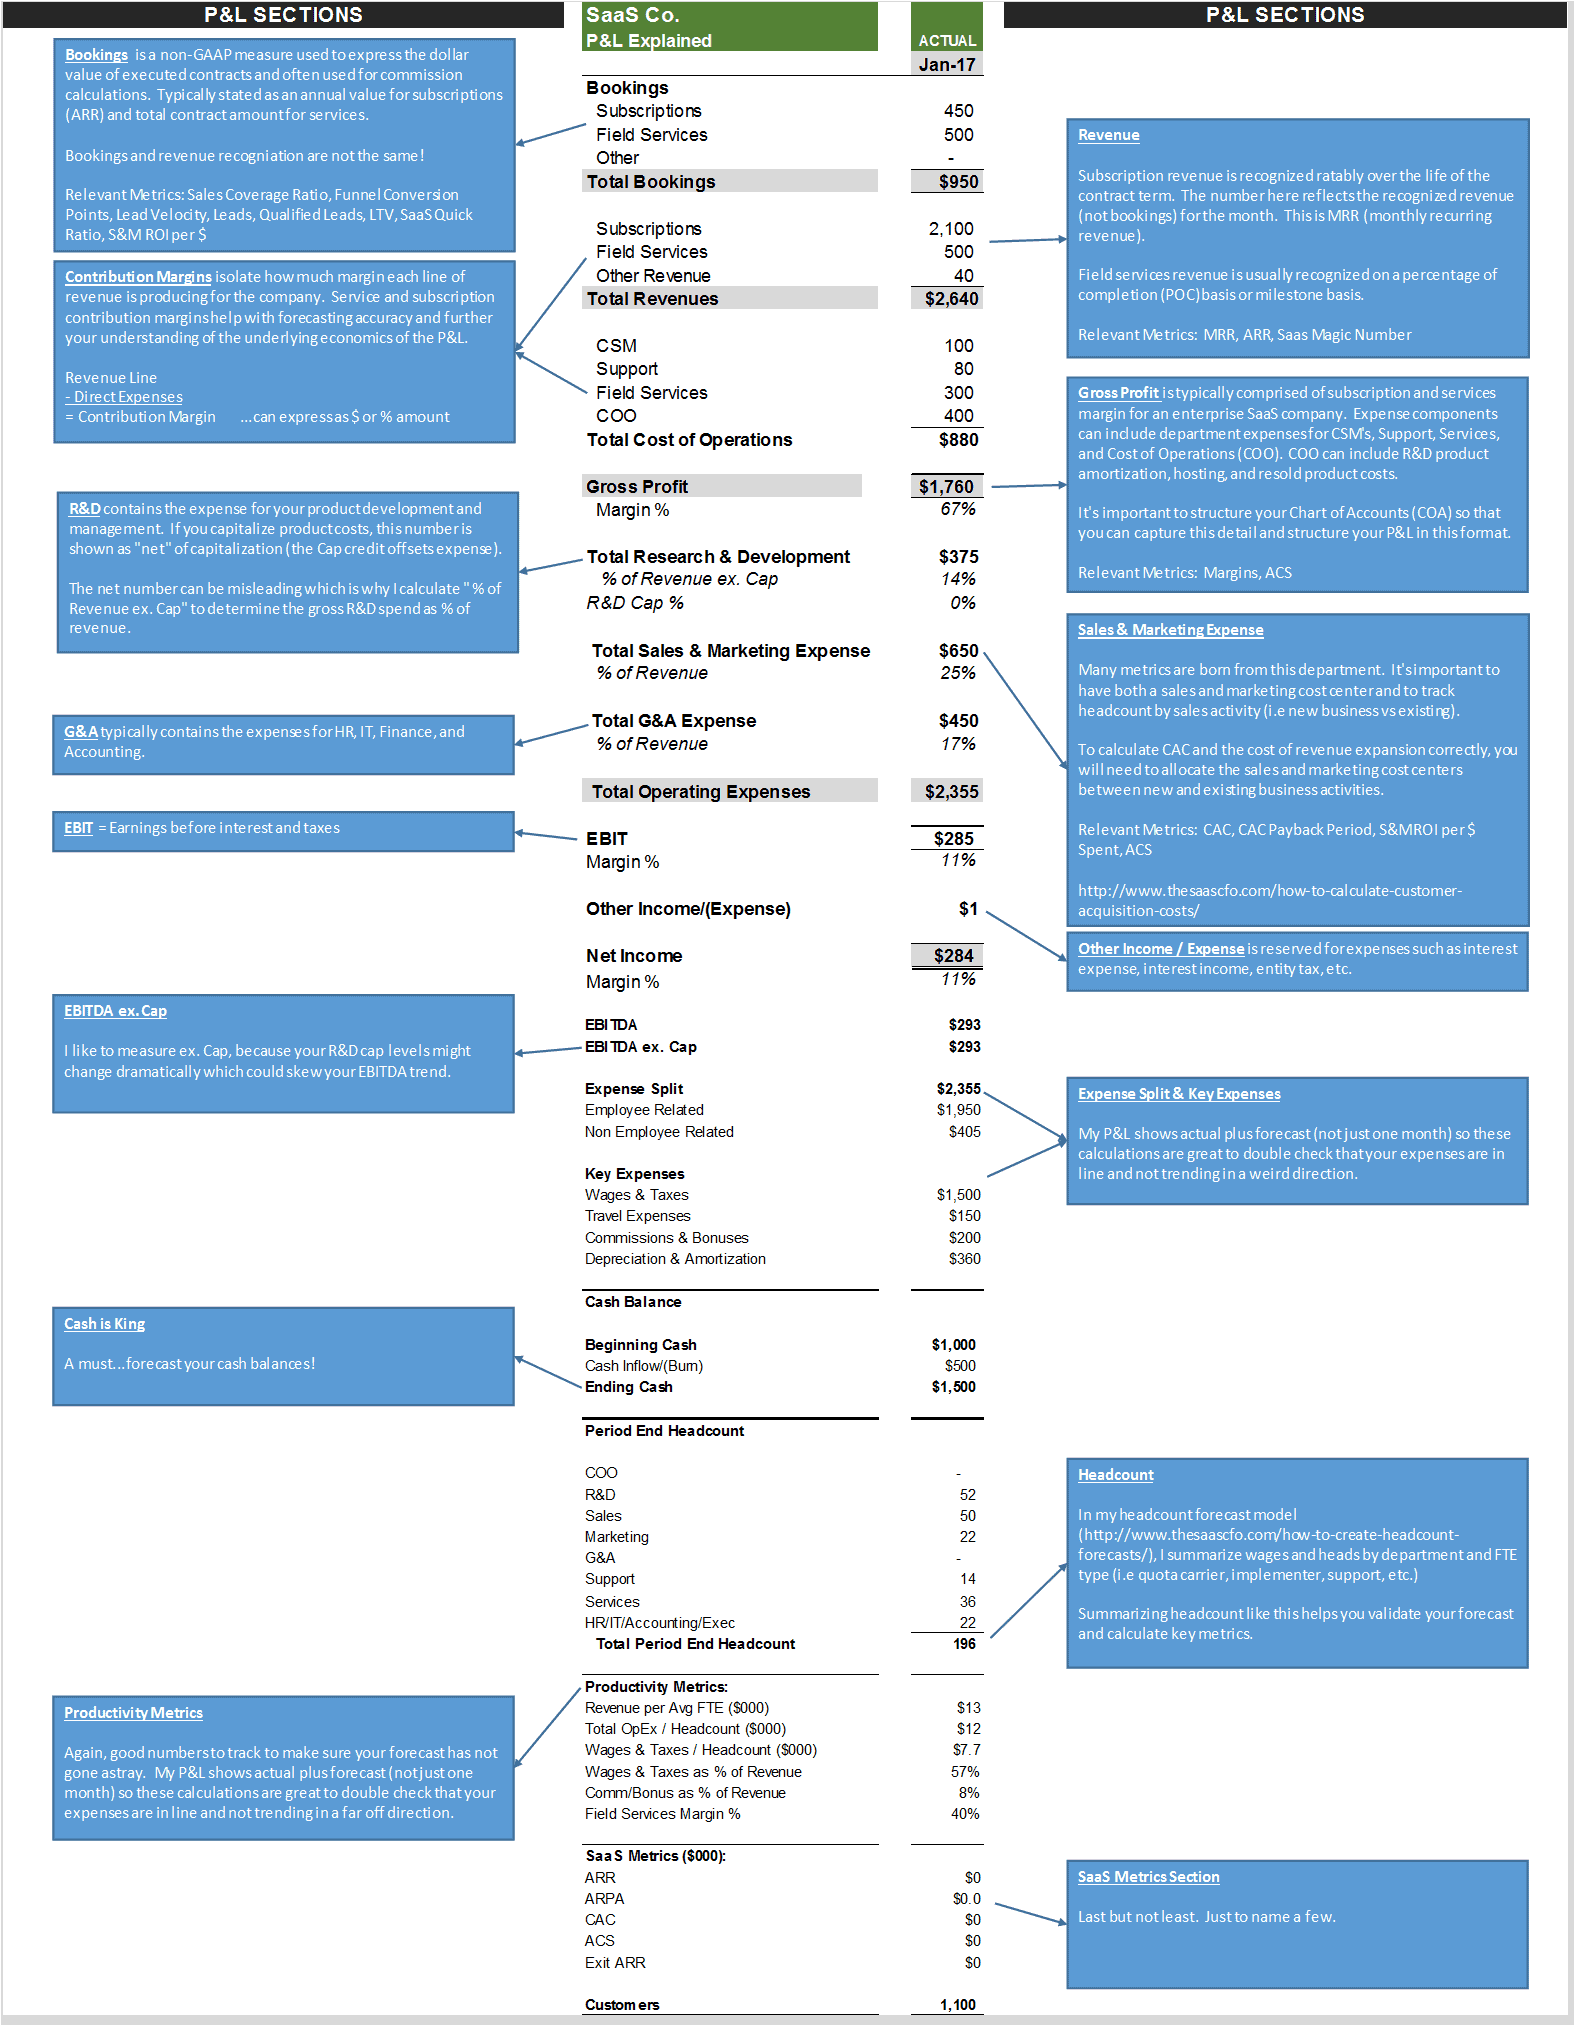
You can’t manage a SaaS business by only using the standard financial statements. To really understand the underlying economics of your business, you must have a properly structured “software” or SaaS P&L (Profit and Loss Statement).
You must also calculate the relevant SaaS metrics and margins for your business. The SaaS P&L Explained “infographic” below walks you step-by-step through my SaaS P&L.
SaaSify Your Finance Foundation
I follow a five step process to SaaSify your finances.
- The proper chart of accounts for a SaaS company
- Proper tracking of finance, people, bookings, and customer/revenue data
- The configuration of your SaaS P&L
- The buildout of your forecast model
- The calculation of SaaS metrics
Notice that SaaS metrics are the LAST thing I do. We have to put these steps in place first before we calculate your metrics.
The Proper SaaS P&L Setup
This is one of my most requested SaaS coaching sessions. And these founders and finance teams are spot on when requesting this coaching.
Make it easy on your Board, investors, and potential investors when sending them your P&L. The out-of-the-box P&L from you accounting software just doesn’t cut it!
Things to consider:
- Clear and distinct revenue streams
- COGS vs OpEx coding
- Your COGS structure is dictated by your revenue streams
- OpEx is always R&D, Sales, Marketing, and G&A
There is so much information we can take from a properly formatted SaaS P&L.
- Our pricing model
- Overall gross profit
- Margins by revenue stream
- Our OpEx profile
- EBITDA
- Trends
To download the Excel file, please enter your valid email below (no spam) for the instant download. I’ll keep you updated on future SaaS Excel models.
If you do not receive the download, please contact me.
How do you structure your P&L? By no means is my P&L the only way. Please post comments or feedback below.
I have worked in finance and accounting for 25+ years. I’ve been a SaaS CFO for 8+ years and began my career in the FP&A function. I hold an active Tennessee CPA license and earned my undergraduate degree from the University of Colorado at Boulder and MBA from the University of Iowa. I offer coaching, fractional CFO services, and SaaS finance courses.
Hi Ben;
Thanks for your post. As a former CEO, I was often reviewing our P&L, revenue forecast, and sales pipeline. As you point out, there are a lot of details behind the topline numbers and some of those details are the dominant drivers (Key Performance Indicators – KPIs) that have the greatest effect on the P&L components. And these dominant KPI are likely different for different industries and business models, so it is particular helpful to see your breakout of the KPI for a SaaS business. Thanks.
Your infographic identifies a metric “revenue per AVG FTE”, which in the spreadsheet is $13,000. While this is a useful metric to monitor efficiency, I think there are other “headcount” related KPIs that can be forward looking. For example, “Bookings per Sales FTE.” can reflect the health of the pipeline and future revenue of the company. Others include “New signups per pre-sales support agent.” Also, another important metric to track that can affect churn is “paying subscriptions per support agent.” Do you have any SaaS norms to share that would bound the acceptable range of these two metrics? I am particularly interested in the case where B2C inbound marketing, SEO, SMM, and website subscriptions (light sales touch) is the primary sales funnel.
Thanks again for a great infographic.
Hi Tom,
Thank you for the reply. Yes, Bookings per Sales FTE or the Sales Coverage Ratio is a simple yet effective metric to measure in your P&L and forecast P&L. You can easily see if your bookings forecast is realistic or not.
If I run across the metrics you are looking for, I will let you know.
Ben
Hi Ben,
How are cancelation ( refunds) recorded ? (1) in ARR booking, do we reduce and readjust or just keep it separate and book it under a separate GL account “Credit/Refund” in PL. (2) if we choose to reduce ARR to reflect, should we re-write past financial revenue?
Hi Akaash,
I would not open up prior periods unless it was a material mistake. Typically, you issue a credit note which offsets all revenue recognized to that point and the future revenue. It also removes the AR balance. Regarding bookings, it was an immediate cancellation and remove from bookings, this could affect commissions calculations.
Ben
Hi Ben,
How would you analyze costs for S&M, G&A, and R&D in an early stage funded start up that is not yet profitable? I’ve seen the 40/20/20 rule but that is as a percent of revenue. Is there an ideal ratio for these buckets as a percentage of total spend? Or some other measure?
Hi Valerie,
Early in the life of a SaaS startup, it is really hard to say what those percentages will be. Because the numbers are so small on the P&L, these ratios can be very sensitive. You can check out my post on SaaS Operating Leverage to see how Hubspot’s percentages trended.
Ben
Hi Ben,
Thank you for this great article.
We are going to have costs regarding ISO Certification and some security checks that will be run quarterly. I am in doubt where to allocate those expenses. Should. it be under cost of operations or G&A expense? Could you please advise?
Thanks in advance!